
 Home
Home News
News
- Synthetix reclaimed over 200% in the last 7 weeks amid high speeds.
- Last week traders saw a long legged Doji candle, so the price remains inside the previous weekly candle.
- The market cap of the SNX token is up 12% in the green zone in the last 24 hours.
The synthetix token outperformed over the past few weeks as b buyers finally reversed the altcoin near its 90-day low. The SNX token has delivered astonishing returns amid the bullish momentum, in fact, in a matter of a few weeks, the SNX token has delivered over 200% returns so far if one bought it near the bottom floor.

However, SNX Crypto noted a 2022 low of $1.4 mark where weekly price candlestick noted a bullish pin bar pattern. Thus, in terms of the daily price scale, the altcoin continues to move with a high-low pattern. Meanwhile, at the time of writing, the synthetix token is trading at the $3.8 mark against USDT.

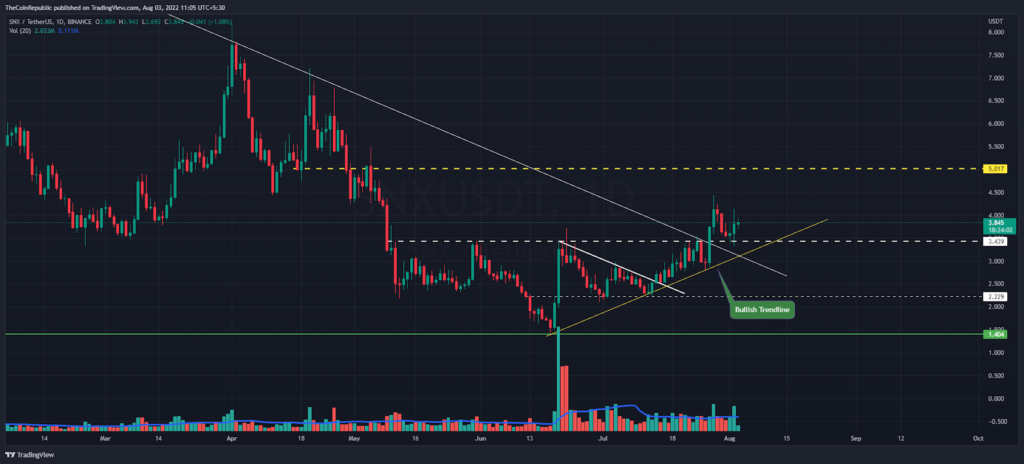
Recently, buyers showed their dominance as they turned the $3.5 resistance level into immediate support with massive trading volume. Thus, buyers are buying a dip, therefore, the coin sees an ascending trendline above. Amidst the rally, last week traders saw a long legged Doji candle, so the price remains inside the previous weekly candle.
Is it Time to Make Money?
The SNX token seems to be bullish as buyers continue buying the asset. Meanwhile, the market cap of SNX token is in the green zone by 12% in the last 24-hours. As well, trading volume shows more than average buying nowadays.
Technical Indicators
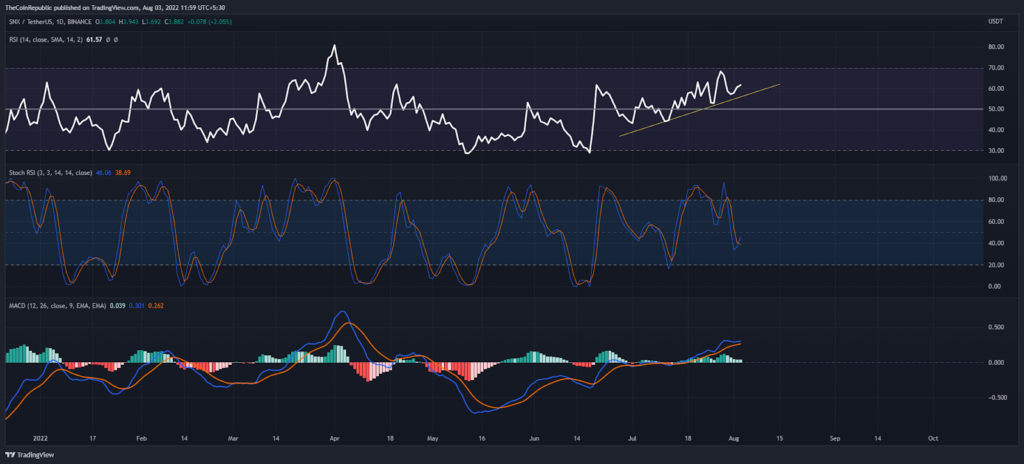
The Simple RSI indicator is headed towards the extremely overbought zone as its peak continues increasing above the upwards trendline (white). As well, the Stoch RSI indicator is going to begin moving higher from the lower side.
In addition, the MACD indicator continues increasing higher into the positive region in the course of daily price scale.
Conclusion
The Synthetix token is detecting above the ascending trendline as well as $3.5-support level. The technical indicators suggest the buyers’ dominance. As well, weekly price action shows a robust rally so far.
Support level- $3.5 and $2.0
Resistance level- $5.0 and $8.0
Disclaimer
The views and opinions stated by the author, or any people named in this article, are for informational ideas only, and they do not establish financial, investment, or other advice. Investing in or trading crypto assets comes with a risk of financial loss.

Nancy J. Allen is a crypto enthusiast, with a major in macroeconomics and minor in business statistics. She believes that cryptocurrencies inspire people to be their own banks, and step aside from traditional monetary exchange systems. She is also intrigued by blockchain technology and its functioning. She frequently researches, and posts content on the top altcoins, their theoretical working principles and technical price predictions.


