
 Home
Home News
News

- Fantom coin seems to be slightly bullish in terms of the weekly price scale.
- Finally, the FTM price reached near 100-day moving average after a long time.
- The pair price of FTM crypto along with the Bitcoin is green by 5.8% at 0.00001532 Satoshis.
Fantom coin attempted to recover its losing cost after a recent decline in Crypto Market. FTM crypto also observes bullish on a higher time frame but buyers are still not so active. After slipping below the key round level of $1.0.

At the time of writing, the FTM coin is in the green zone by 2.6% while it is trading at $0.349 Mark. Despite bullish trends in the higher time frame, the FTM coin continues getting rejections for a more bullish rally near the $0.36-resistance zone.

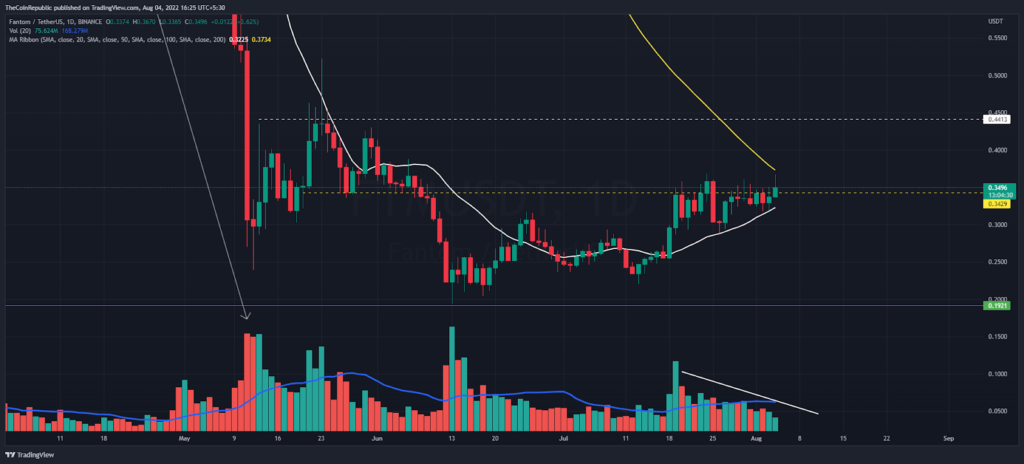
After reversing from the 2022 lowest level, buyers again got a chance to manage altcoin price above the 20-day moving average (white) in the course of the daily price scale. 20 DMA became support while FTM price reached near 100-day moving average after a long time. Buyers may see a drop here as trading volume continues to decline.
Traders may see an increase in volatility while retesting the 100 DMA level. Besides, the Market Cap of the FTM coin is increasing gradually at $889 Million as per the CMC. If buyers break 100 DMA then, the worth of FTM crosses $900 million soon. Along with that, The pair price of FTM crypto with Bitcoin is green by 5.8% at 0.00001532 Satoshis.
RSI Suggests Sideways Trend for FTM coin
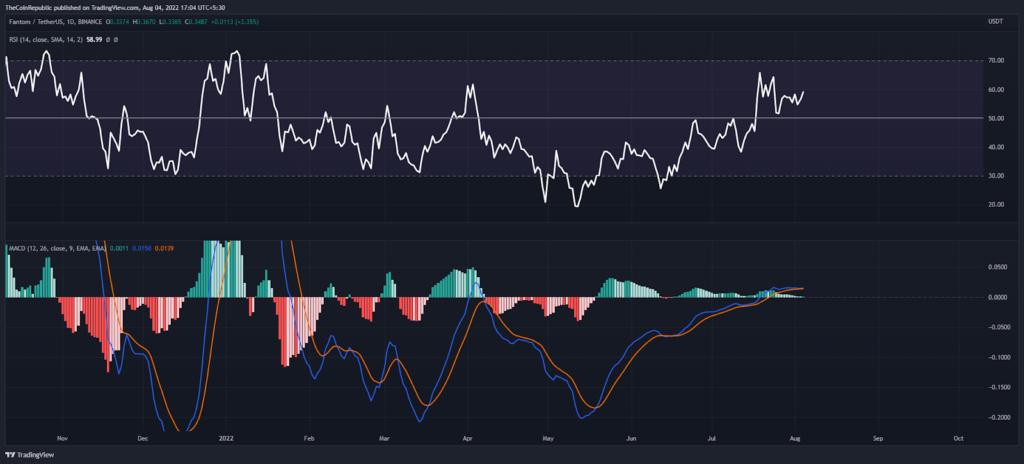
In terms of the daily price scale, however, the RSI indicator is above the semi-line but suggests sideways momentum for the Fantom coin. Conversely, the MACD increases in a higher positive region after a bullish crossover.
Conclusion
Fantom coin has frequently gotten rejection near the $0.36 resistance level for the past several days. But the price reached the 100-day moving average, at this zone bears may attempt to sell off ahead.
Technical Levels
Resistance level- $0.50 and $1.0
Support level- $0.20 and $0.15
Disclaimer
The views and opinions stated by the author, or any people named in this article, are for informational ideas only and do not establish financial, investment, or other advice. Investing in or trading crypto assets comes with a risk of financial loss.
Steve Anderson is an Australian crypto enthusiast. He is a specialist in management and trading for over 5 years. Steve has worked as a crypto trader, he loves learning about decentralisation, understanding the true potential of the blockchain.


