
 Home
Home News
News

- Ethereum Classic price is trying to sustain at the current level as bulls and bears both showcasing their abilities.
- ETC crypto has recovered above 20, 50, 100 and 200-days Daily Moving Average.
- The pair of ETC/BTC is at 0.00165 BTC with an intraday gain of 3.59%.
Ethereum Classic price has successfully escaped the falling wedge pattern over the daily price chart. The token has started its recovery phase and recovered significantly just after leaving the falling wedge pattern. ETC bulls have showcased some great strength in the past few trading sessions. However, bears also tried to short the market for ETC crypto but failed to impact the overall bullish move. ETC investors must wait until bulls sustain and the token surge more towards its recovery.

Ethereum Classic price is presently approximated at $38.26 and has gained 3.03% of its market capitalization in the last 24-hour period. Trading volume has increased by 31% in the intraday trading session. This indicates that buyers are getting involved in the trade for ETC crypto. Volume to market cap ratio is 0.2858.

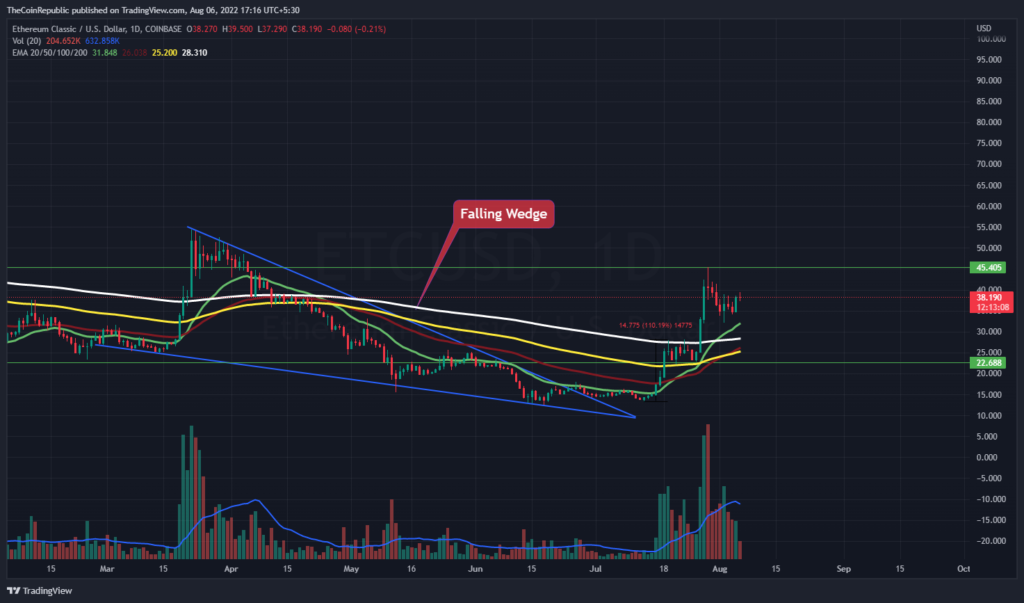
ETC coin price is trying to sustain at the current level after recovering significantly over the daily price chart. ETC bulls have tried to maintain the strong bullish momentum to surge over the chart. However, volume change can be seen below average and needs to grow for ETC to recover above $45.00.
What do Technical Indicators suggest about ETC?
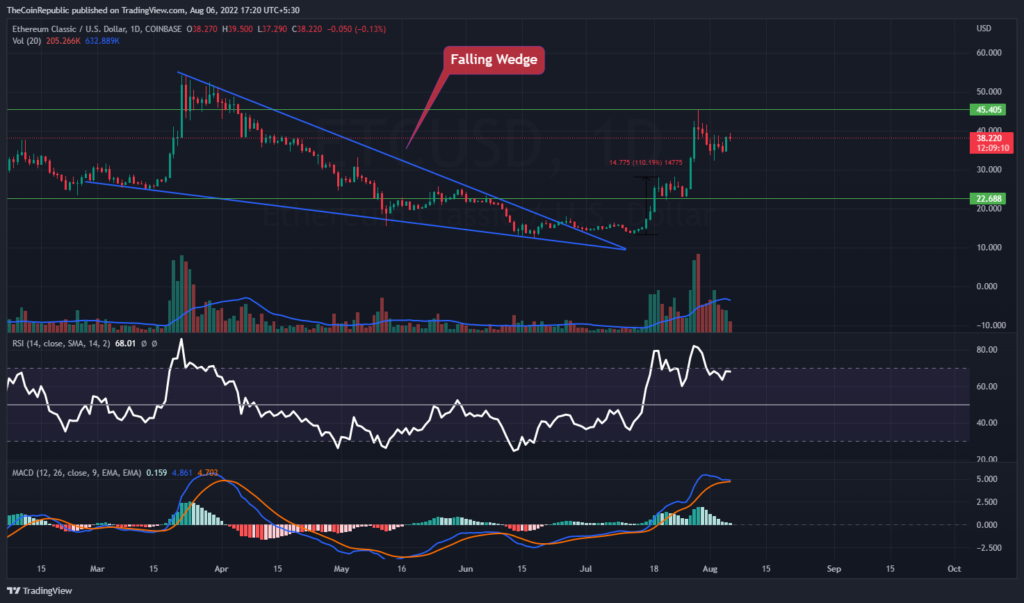
ETC coin price is trying to sustain at the current level as bulls falter to maintain the current uptrend momentum over the daily chart. Bears may interrupt the momentum and try to pull the token back towards the lower level. Technical indicators suggest the sideways momentum of ETC coin.
Relative STrength Index showcases the sideways momentum of ETC coin. RSI is at 67 and is trying to sustain just below the overbought territory. MACD exhibits the consolidation phase of ETC coin. The MACD line is parallel to the signal line showcasing the consolidation phase. ETC investors must wait for any directional change over the daily chart.
Conclusion
Ethereum Classic price has successfully escaped the falling wedge pattern over the daily price chart. The token has started its recovery phase and recovered significantly just after leaving the falling wedge pattern. ETC bulls have showcased some great strength in the past few trading sessions. However, bears also tried to short the market for ETC crypto but failed to impact the overall bullish move. However, volume change can be seen below average and needs to grow for ETC to recover above $45.00. However, volume change can be seen below average and needs to grow for ETC to recover above $45.00. ETC investors must wait for any directional change over the daily chart.
Technical Levels
Support Levels: $35.00 and $32.00
Resistance Levels: $40.00 and $45.00
Disclaimer
The views and opinions stated by the author, or any people named in this article, are for informational ideas only, and they do not establish the financial, investment, or other advice. Investing in or trading crypto assets comes with a risk of financial loss.

Nancy J. Allen is a crypto enthusiast, with a major in macroeconomics and minor in business statistics. She believes that cryptocurrencies inspire people to be their own banks, and step aside from traditional monetary exchange systems. She is also intrigued by blockchain technology and its functioning. She frequently researches, and posts content on the top altcoins, their theoretical working principles and technical price predictions.


