
 Home
Home News
News

- After experiencing a decline, the HBAR price is currently trading in a range of a long-term sideways trend over the daily price chart.
- The technical indicators are calling for a bearish movement, investors need to be alert.
- The HBAR/BTC pair is at 0.000003326 BTC which is at a gain of 0.45%.
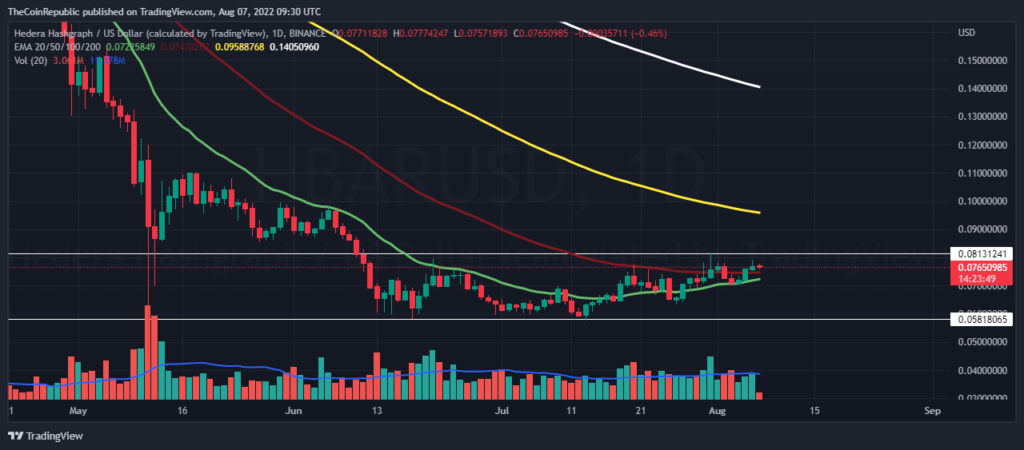
The HBAR price after facing a downtrend is now trading in range of a sideways trend for a long time. We can observe the battle of bulls and bears closely for dominance over the market, currently the bears are pushing the price to the lower level of the renege. The coin needs its bulls to register a successful breakout, or else if the same situation persists we can witness a breakdown which will create a difficult situation for the bulls, as the recovery will be very difficult after the breakdown.

The Reason behind this empowerment of the bears is the support from the greatest dominator of the cryptocurrency market, Bitcoin. Today the BTC price slumped below the 23K level, which is giving bears a free hand and the whole market has started sinking. The investors should wait before making any move.

The current price for one HBAR coin is moving at $0.076 which is at a small loss of 0.53% in its market capitalization in the last 24 hrs. The coin has a trading volume of 28 million with a significant loss of 9.22% in the 24 hrs trading session and has a market cap of 1.6 billion. The volume market cap ratio is 0.01821.
Short-term Story of HBAR
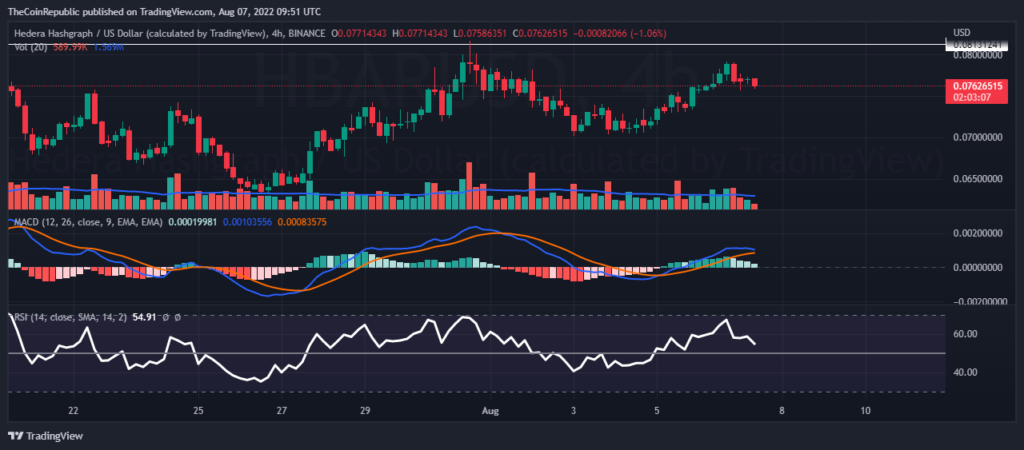
While analyzing the short term (4 hrs) chart for HBAR we can observe the bread pushing the price down after an uptrend movement.
The MACD indicator shows the MACD line which is moving above the MACD signal line is about to make a cross over the MACD signal line from above which indicates the increase in selling volume. The relative strength index is diving continuously amid this selling pressure over the coin. The RSI value is nearly equal to 55.
Conclusion
The HBAR price after facing a downtrend is now trading in range of a sideways trend for a long time. The coin needs its bulls to register a successful breakout, or else if the same situation persists we can witness a breakdown. The Reason behind this empowerment of the bears is the support from the greatest dominator of the cryptocurrency market, Bitcoin. While observing the hourly chart we can observe the same downtrend movement. The technical indicators also appear in favor of bears presently.
Technical levels
Resistance levels: $0.081 and $0.098
Support levels: $0.057 and $0.045
Disclaimer
The views and opinions stated by the author, or any people named in this article, are for informational ideas only, and they do not establish the financial, investment, or other advice. Investing in or trading crypto assets comes with a risk of financial loss.

Andrew is a blockchain developer who developed his interest in cryptocurrencies while pursuing his post-graduation major in blockchain development. He is a keen observer of details and shares his passion for writing, along with coding. His backend knowledge about blockchain helps him give a unique perspective to his writing skills, and a reliable craft at explaining the concepts such as blockchain programming, languages and token minting. He also frequently shares technical details and performance indicators of ICOs and IDOs.


