
 Home
Home News
News

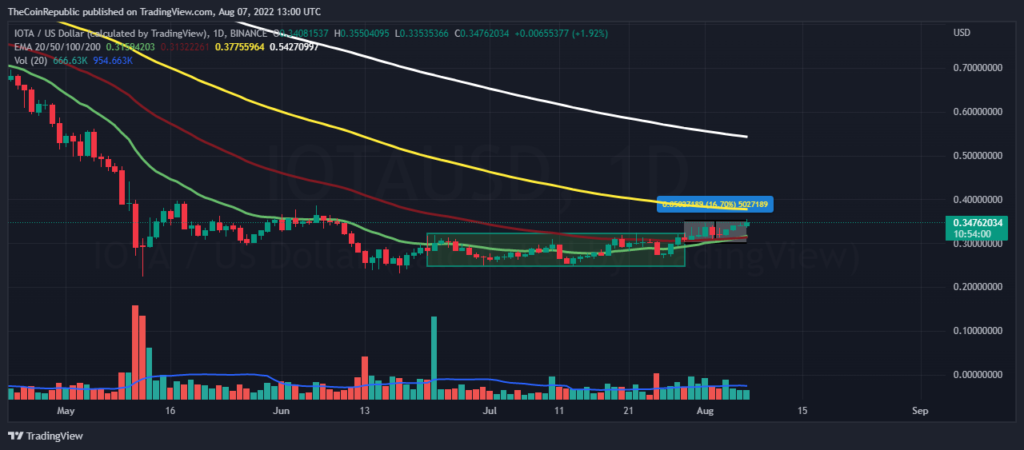
- The IOTA bulls finally gathered and registered a breakout above the daily price chart after trading inside a parallel band of sideways trend.
- The uptrend movement which IOTA price is experiencing is about to end soon as believed by analysts.
- The IOTA/BTC pair is at 0.00001499 BTC which at a small gain of 0.81%
After trading inside a parallel range of sideways trend the IOTA bulls finally accumulated and registered a breakout over the daily price chart. The price rose 16 percent in ten days as a result of the breakout, but this increase is insufficient to make up for the investors’ significant losses. The coin needs to attract some more buyers to speed up the process.

Here one major support for the IOTA price is the trading volume which is at a big gain of 31% over the 24 hrs trading session. Analysts believe this uptrend movement can be an initiation of the recovery phase, it is now just a matter of consistency. Well talking about the ones who are willing to enter the market, it is not a correct time as the prices may soon reach exit levels.

The current price for one IOTA coin is trading at $0.34 which is at a gain of 1.20% in its market capitalization in the last 24 hrs. The coin has a trading volume of 16 million which is at a huge gain of 34.11% over the intraday trading session and has a market cap of 967 million. The volume market cap ratio is 0.01718.
What do Technical Indicators Suggest for IOTA?
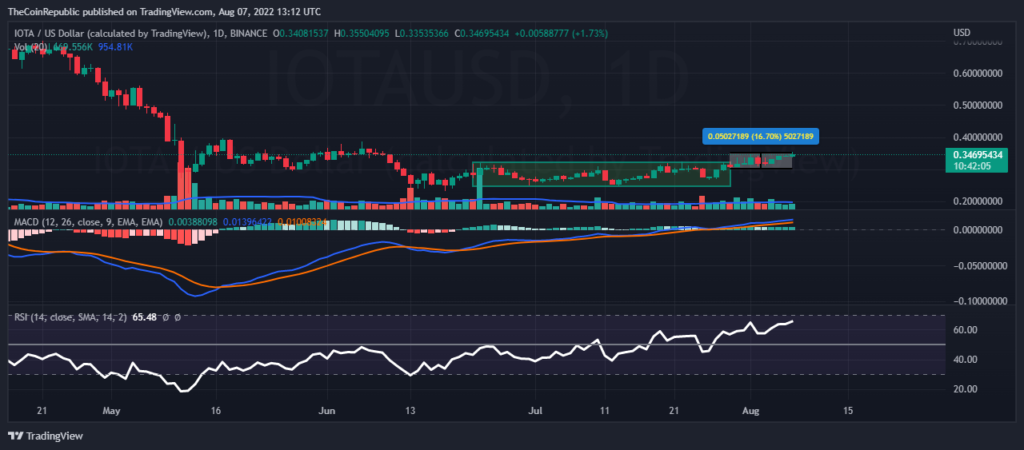
The volume even after gaining a huge percentage is still moving below the average over the daily and hourly price chart.
The MACD indicator over the daily chart shows the buyers line is moving above the sellers signal line supporting the uptrend movement along with histograms growing green. Whereas same with the relative strength index, it is climbing continuously and is approaching the overbought. The RSI value is nearly equal to 65. This shows the span of recovery is about to end soon, as the sellers will be back to the market as soon as the price will hit the overbought mark.
Conclusion
After trading inside a parallel range of sideways trend the IOTA bulls finally accumulated and registered a breakout over the daily price chart. The coin needs to attract some more buyers to speed up the process. It is now just a matter of consistency to watch how far the bulls can carry this recovery. The indicators support a bullish movement and on the other hand the RSI speaks chances of an increase in selling pressure is ahead as soon as the price hits the overbought mark.
Technical levels
Resistance levels: $0.388 and $0.0440
Support levels: $0.304 and $0.274
Disclaimer
The views and opinions stated by the author, or any people named in this article, are for informational ideas only, and they do not establish the financial, investment, or other advice. Investing in or trading crypto assets comes with a risk of financial loss.
Steve Anderson is an Australian crypto enthusiast. He is a specialist in management and trading for over 5 years. Steve has worked as a crypto trader, he loves learning about decentralisation, understanding the true potential of the blockchain.


