
 Home
Home News
News

- Flow price has successfully breakout of the parallel channel it has been trading in over the daily price chart.
- FLOW crypto has recovered above the 20, 50, and 100-day Daily Moving Average.
- The pair of FLOW/BTC is at 0.0001258 BTC with an intraday gain of 8.06%.
Flow price has successfully recovered above the ascending parallel channel over the daily price chart. Flow price is moving upward with a small upward momentum throughout the daily price chart. The token first traded below a line with a downward slope, but was able to move out of the pattern and into the channel with an upward slope. The current increasing momentum needs to be sustained for the token to cross the daily chart. FLOW investors must wait for the token to regain momentum and reach a meaningful resistance level. FLOW coin is currently trading between the upper and lower trendlines of the ascending parallel channel. The token needs to get the required upward push from flow bulls in order to go closer to the upper trendline.

The estimated current value of the Flow price is $3.02, and on the last day, it increased its market capitalization by 12.96%. The volume of transactions increased by 170% during the intraday trading session. This exemplifies how bulls are attempting to allow FLOW to exit the parallel channel. Volume to market cap ratio is 0.1627.

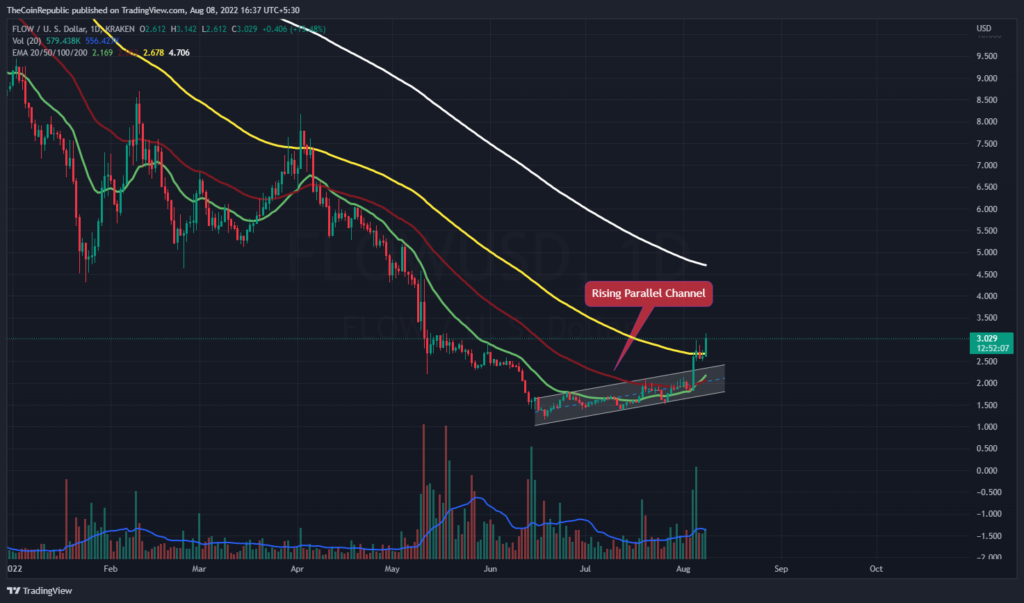
On the daily chart, the price of Flow coin is presently moving inside a rising parallel channel. The Flow currency is currently approaching the trendline, hence FLOW bulls must maintain their position at the trendline. In order to lessen the volatility brought on by bears during the intraday trading session, the volume change of the FLOW coin, which is now below average, needs to improve. FLOW crypto has recovered above the 20, 50, and 100-day Daily Moving Average.
What do Technical Indicators suggest about FLOW?
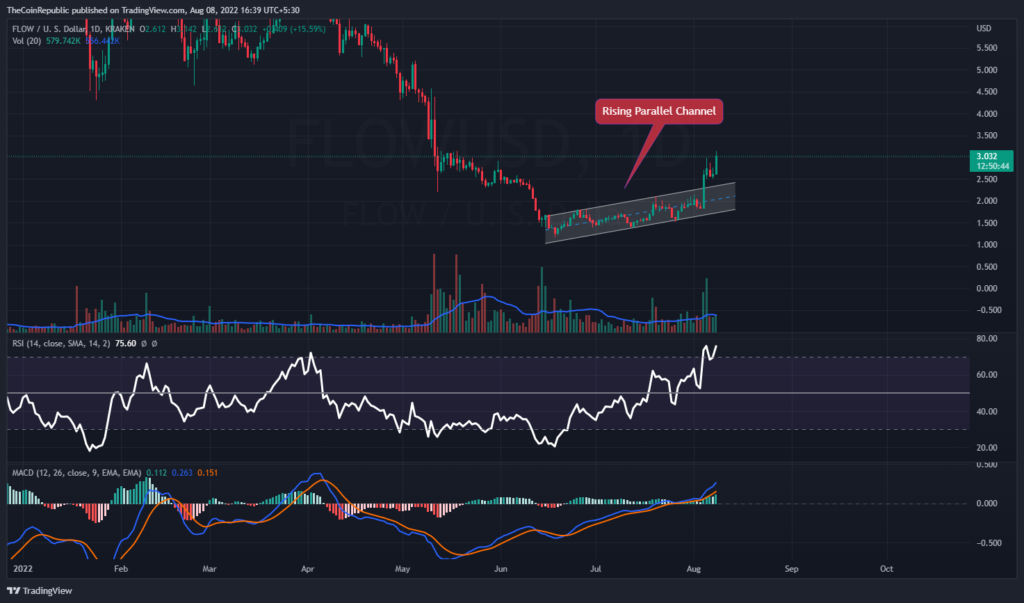
The price of flow coin has been varying across the daily price chart within an upward parallel channel. The coin needs to accelerate in the direction of the top trendline in order to escape the ascending pattern. Technical indicators point to the FLOW coin’s rising momentum.
The relative Strength Index showcases the uptrend momentum of FLOW coin. RSI is at 75 and has entered the overbought territory. MACD exhibits the bullish momentum of the FLOW coin. The MACD line is ahead of the signal line after a positive crossover.
Conclusion
Flow price has successfully recovered above the ascending parallel channel over the daily price chart. Flow price is moving upward with a small upward momentum throughout the daily price chart. The token first traded below a line with a downward slope, but was able to move out of the pattern and into the channel with an upward slope. The current increasing momentum needs to be sustained for the token to cross the daily chart. In order to lessen the volatility brought on by bears during the intraday trading session, the volume change of the FLOW coin, which is now below average, needs to improve. Technical indicators point to the FLOW coin’s rising momentum. RSI is at 75 and has entered the overbought territory. MACD exhibits the bullish momentum of the FLOW coin.
Technical Levels
Support Levels: $2.50 and $1.85
Resistance Levels: $3.15 and $3.25
Disclaimer
The views and opinions stated by the author, or any people named in this article, are for informational ideas only, and they do not establish the financial, investment, or other advice. Investing in or trading crypto assets comes with a risk of financial loss.

Andrew is a blockchain developer who developed his interest in cryptocurrencies while pursuing his post-graduation major in blockchain development. He is a keen observer of details and shares his passion for writing, along with coding. His backend knowledge about blockchain helps him give a unique perspective to his writing skills, and a reliable craft at explaining the concepts such as blockchain programming, languages and token minting. He also frequently shares technical details and performance indicators of ICOs and IDOs.


