
 Home
Home News
News

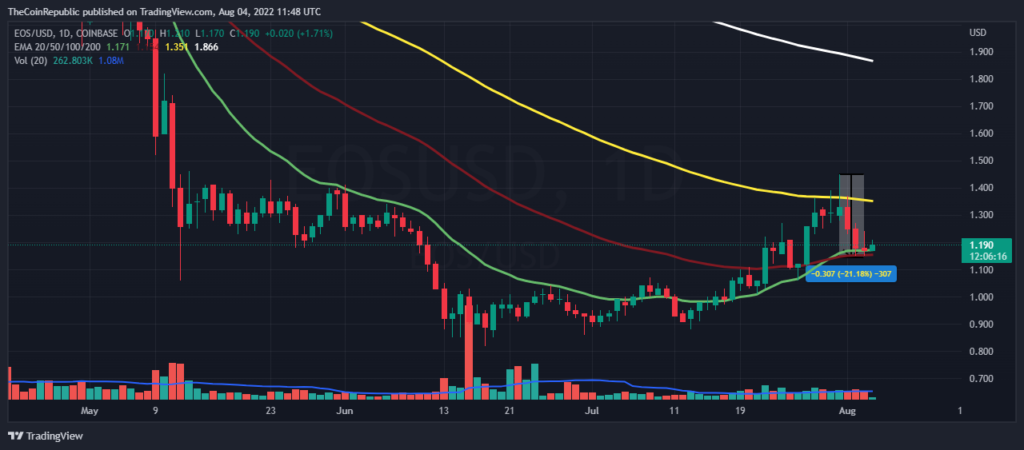
- The bears broke up the good uptrend that the EOS price was in on the daily price chart.
- The manipulative technical indicators approach investors to wait before making any move.
- The EOS/BTC pair is at 0.00005173 BTC which is at an insignificant loss of 0.28%.
The EOS price was at a good uptrend movement when the bears interrupted it over the daily price chart. They made the price fall approximately 21% in just days, after this fall the bulls are again accumulating and trying to to pound the price but are facing a backlash amid the bearish pressure.

It looks like bears are not ready to let the bulls make a dominant move so they are increasing selling pressure. The coin strictly needs to accumulate bulls so as to make this recovery attempt successful or else the previous efforts of recovery will also be wasted. As the coin has good potential, it just needs some support and can give huge profits to its investors. Before making any move the investors need to wait a bit.

The price for one EOS coin is currently trading at $1.19 which is at a loss of 2.34% in its market capitalization the last 24 hrs. The coin has a trading volume of 241 million which is currently at a loss of 14.74% in the 24 hrs trading session and a market cap of 1.18 billion. The volume market cap ratio for EOS is at 0.2036.
Can EOS Bulls Make a Successful Recovery?
We can observe a close battle between the bulls and bears over the short term (4 hrs) price chart. No one is ready to loosen their grip.
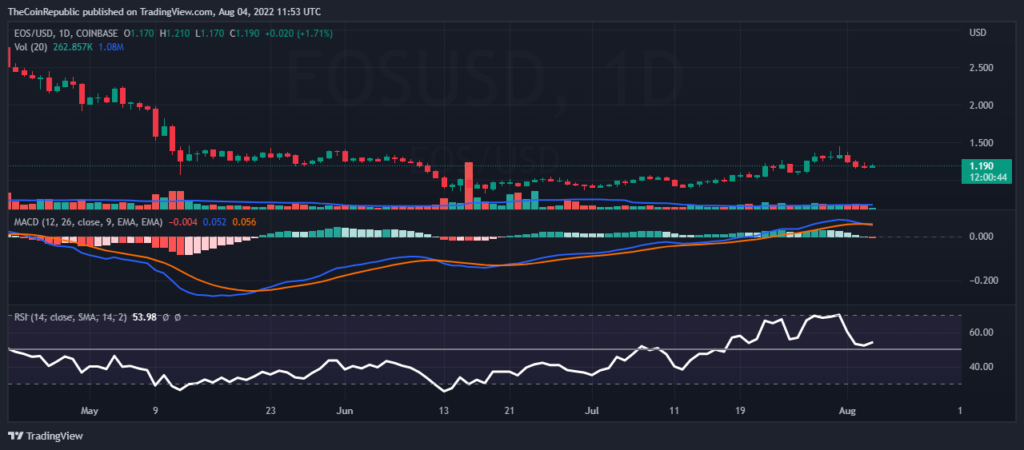
The MACD exhibited a fresh negative cross and now the buyers line is below the sellers signal line indicating the active participation of the bears along with the support red histograms. The relative strength index on the contrary is showing the increase in buyings and hence is moving towards the upper region. The RSI value is above 50. Watching this manipulative behavior of indicators the investors should wait before taking any step.
Conclusion
The EOS price was at a good uptrend movement when the bears interrupted it over the daily price chart. The coin has good potential, it just needs some support and can give huge profits to its investors. Both the gangs are having a neck to neck battle which can be observed over the hourly price chart. The technical indicators appear to be manipulative here and watching this manipulative behavior of indicators the investors should wait before taking any step.
Technical levels
Resistance levels: $1.45 and $1.82
Support levels: $1.06 and $0.88
Disclaimer
The views and opinions stated by the author, or any people named in this article, are for informational ideas only, and they do not establish the financial, investment, or other advice. Investing in or trading crypto assets comes with a risk of financial loss.

Andrew is a blockchain developer who developed his interest in cryptocurrencies while pursuing his post-graduation major in blockchain development. He is a keen observer of details and shares his passion for writing, along with coding. His backend knowledge about blockchain helps him give a unique perspective to his writing skills, and a reliable craft at explaining the concepts such as blockchain programming, languages and token minting. He also frequently shares technical details and performance indicators of ICOs and IDOs.


