
 Home
Home News
News

- ApeCoin price struggles at the lower trendline of the rising parallel channel over the daily price chart.
- APE Crypto is trading at 20 EMA above 50 EMA and below 100 and 200-days Daily Moving Average.
- The pair of APE/BTC is at 0.0002722 BTC with an intraday drop of 2.78%.
On the daily price chart, the price of ApeCoin has been trading inside an ascending parallel channel since July 13. The accumulation phase on the daily chart indicates that the coin began to grow on July 13th. Bulls attempted to draw the coin toward the upper trendline of the consolidation phase, but bears kept entangling it in the grips of short-sellers. The price of the APE coin is currently moving with strong downward momentum in the direction of the parallel channel’s lower trendline on the chart. As soon as the APE coin reaches the trendline, it needs to rally the bulls and turn around to prevent dropping below the channel on the daily chart. Investors in APEs must watch the chart for any directional changes.

The estimated price of Apecoin is $6.66, and on the previous day, it lost 2.54% of its market capitalization. In comparison, the intraday trading session has seen a 9.01% increase in trade volume. This shows that buyers are attempting to build up positions in the trade to prevent APE from dropping below the parallel channel. The volume to market cap ratio is 0.1273.

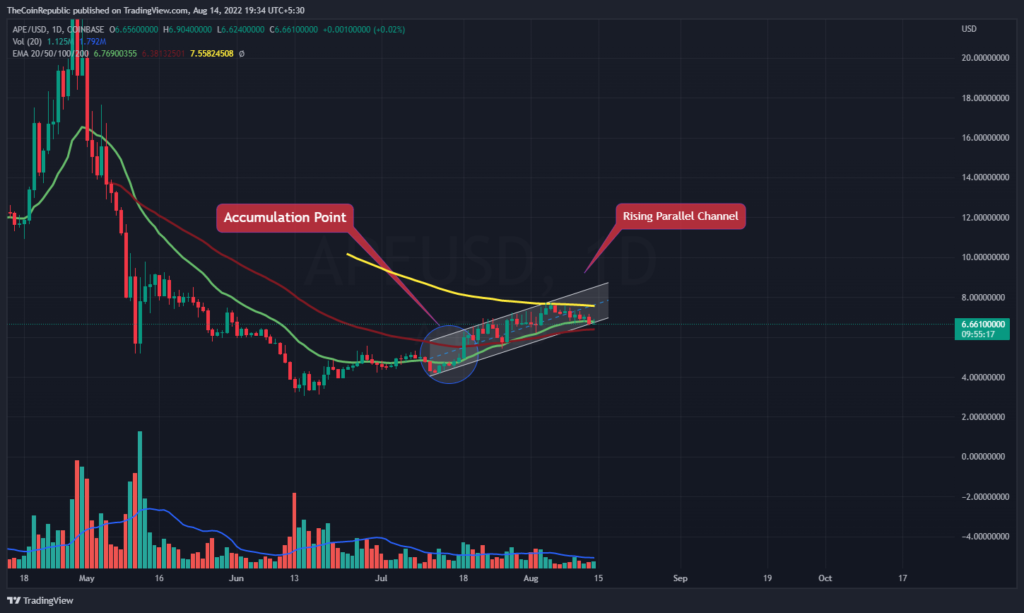
The APE coin price is attempting to strengthen its uptrend by attracting buyers’ support on the daily price chart. For the coin to advance through the parallel channel, more purchasers are required. Volume change, which is now below normal, must increase for APE currency to once again soar through the channel. Investors in APE must wait for any directional change before interpreting the price movement of the APE coin.
What do Technical Indicators suggest about APE?
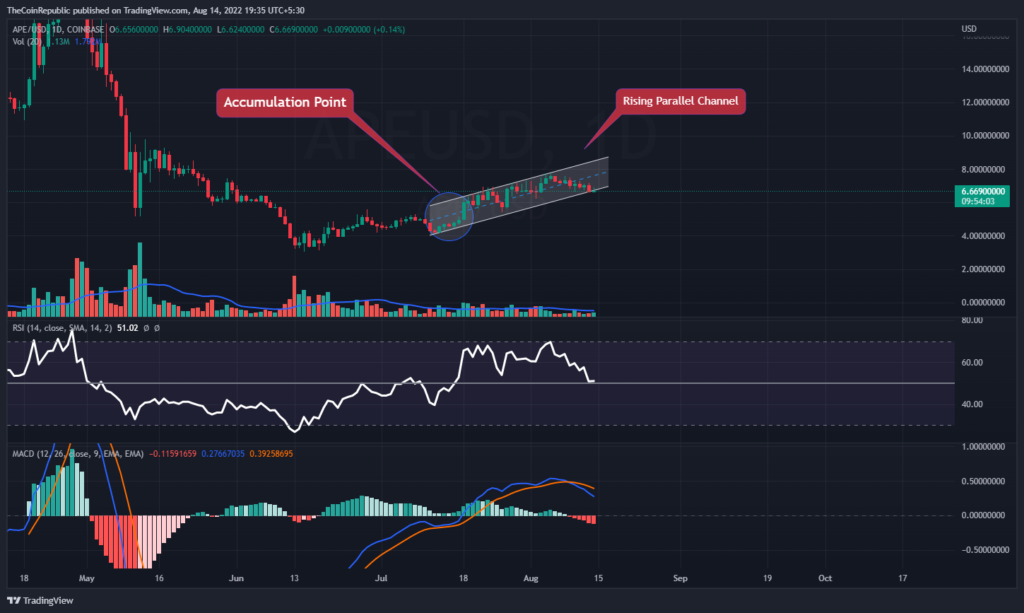
For the price of the APE coin to stay above the parallel channel, additional buyers are needed. APE bulls must gather themselves in the meantime to give the coin a strong throttle and let it burst back within the pattern. Technical indications point to the APE coin’s downward trend momentum.
The APE coin’s momentum in the downturn is displayed by the relative strength index. The RSI is attempting to maintain neutrality at 50. The APE coin’s downward velocity is visible in MACD. After a negative crossover, the MACD line is lower than the signal line. Investors in APEs need to watch for any directional shifts on the daily chart.
Conclusion
On the daily price chart, the price of ApeCoin has been trading inside an ascending parallel channel since July 13. The accumulation phase on the daily chart indicates that the coin began to grow on July 13th. Bulls attempted to draw the coin toward the upper trendline of the consolidation phase, but bears kept entangling it in the grips of short-sellers. The price of the APE coin is currently moving with strong downward momentum in the direction of the parallel channel’s lower trendline on the chart. Technical indications point to the APE coin’s downward trend momentum. Investors in APEs need to watch for any directional shifts on the daily chart.
Technical Levels
Support Levels: $6.00 and $5.75
Resistance Levels: $7.35 and $7.55
Disclaimer
The views and opinions stated by the author, or any people named in this article, are for informational ideas only and do not establish the financial, investment, or other advice. Investing in or trading crypto assets comes with a risk of financial loss.

Andrew is a blockchain developer who developed his interest in cryptocurrencies while pursuing his post-graduation major in blockchain development. He is a keen observer of details and shares his passion for writing, along with coding. His backend knowledge about blockchain helps him give a unique perspective to his writing skills, and a reliable craft at explaining the concepts such as blockchain programming, languages and token minting. He also frequently shares technical details and performance indicators of ICOs and IDOs.


