
 Home
Home News
News

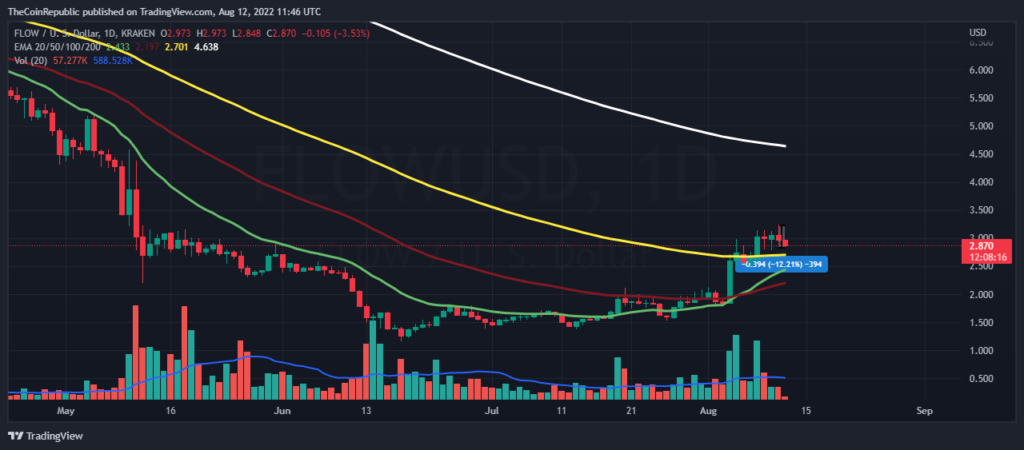
- Finally, the bullish dominance of the FLOW coin over the daily price chart has been challenged by the bears.
- The crypto asset is moving above 20, 50 and 100 days moving average.
- The FLOW/BTC pair is at 0.0001211 BTC with a loss of 2.53% in it.
Bears now finally got an opportunity to take over the bullish dominance of the FLOW coin over the daily price chart. After moving on a good uptrend movement, the FLOW coin is trapped under the bearish pressure and one of the major support of the bears in capturing the market is the leader cryptocurrency, Bitcoin. As the BTC slumped and fell below the 24K mark, all the other altcoins started rallying bearishly.

The FLOW bulls still have time to rescue the coin and save their recovery efforts or else if the bears took over the market dominance once again, they will create a difficult situation for bulls to make the coin recover. The Price approximately dropped 12% in just 2 days. The FLOW bulls should focus on the trading volume as it is at a loss of 20%.

The current price for one FLOW coin is trading at 2.87 USD with a significant loss of 6.34% in its market capitalization in the last 24 hrs. The coin has a trading volume of 216 million which is at a conspicuous loss of 20.17% in the 24 hrs trading session and has a market cap of 2.9 billion. The volume market cap ratio is 0.07248.
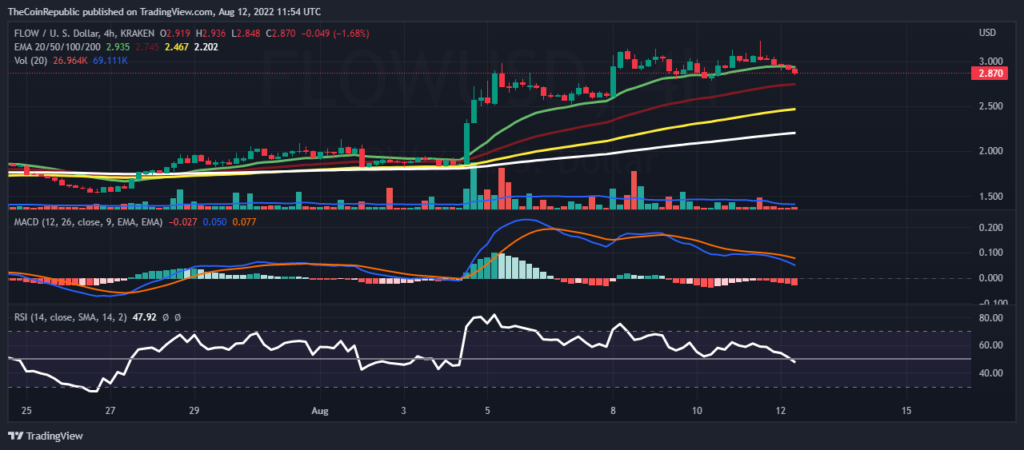
Short-term Story of FLOW
A same downtrend movement can be observed over the short term (4 hrs) chart. This signifies that the bears took advantage of the opportunity they were waiting for.
As we can see the MACD indicator shows the sellers signal line is moving above the buyers line, which shows the hyperactivity of the sellers along with the falling red histograms. The relative strength index supporting the same is diving continuously and indicates a further down trend movement. The RSI value is moving below 50.
Conclusion
Bears now finally got an opportunity to take over the bullish dominance of the FLOW coin over the daily price chart. As the BTC slumped and fell below the 24K mark, all the other altcoins started rallying bearishly. The Price approximately dropped 12% in just 2 days. The short term analysis shows the hyper activity of sellers in the current market as the price climbed and attracted the ones who were willing to make an exit.
Technical levels
Resistance levels: $3.27 and $4.59
Support levels: $2.52 and $1.80
Disclaimer
The views and opinions stated by the author, or any people named in this article, are for informational ideas only, and they do not establish the financial, investment, or other advice. Investing in or trading crypto assets comes with a risk of financial loss.

Nancy J. Allen is a crypto enthusiast, with a major in macroeconomics and minor in business statistics. She believes that cryptocurrencies inspire people to be their own banks, and step aside from traditional monetary exchange systems. She is also intrigued by blockchain technology and its functioning. She frequently researches, and posts content on the top altcoins, their theoretical working principles and technical price predictions.


