
 Home
Home News
News

- Mina price falters to gain the uptrend momentum to register its final breakout from the rising parallel channel.
- MINA Crypto is trading above 20 and 50 EMA but still behind 100 and 200-days Daily Moving Average.
- The pair of MINA/BTC is at 0.00003737 BTC with an intraday drop of 1.74%.
The price of mina is attempting to rise through an upward channel on the daily price chart. The coin is currently regaining as it moves upward toward the upper trendline of the channel. MINA coin has to maintain the momentum of the current rally in order to bounce back and reach a respectable barrier level. MINA bulls must maintain the upward momentum in order to allow the token to break free of the ascending parallel channel with a strong bullish surge. However, bears are making an effort to short the MINA market. Conditions in the bear market make it challenging for cryptocurrencies like MINA to fully recover. Investors in MINA must wait until bulls hold their position at the top trendline of the ascending parallel channel.

With a current estimated price of $0.91, Mina has lost 1.68% of its market value in the last day. However, trading volume decreased by 18.67% during the intraday trading session. This shows that bears who are seeking to pull the token are winning the game against bulls. The volume to market cap ratio is 0.03185.

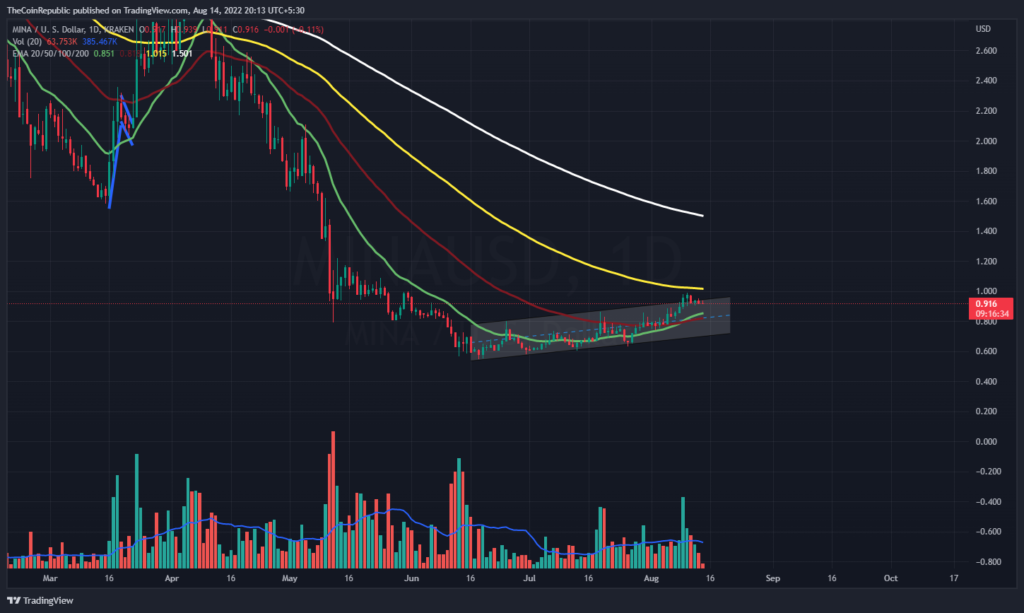
More buyers are required for the MINA coin price to accelerate toward the top trendline of the ascending channel. The volume shift shows that the buildup of bulls is below average and that it needs to be improved if MINA is to soar. A surge toward the upper trendline is necessary for the MINA coin price to begin to rebound on the daily price chart.
What do Technical Indicators suggest about MINA?
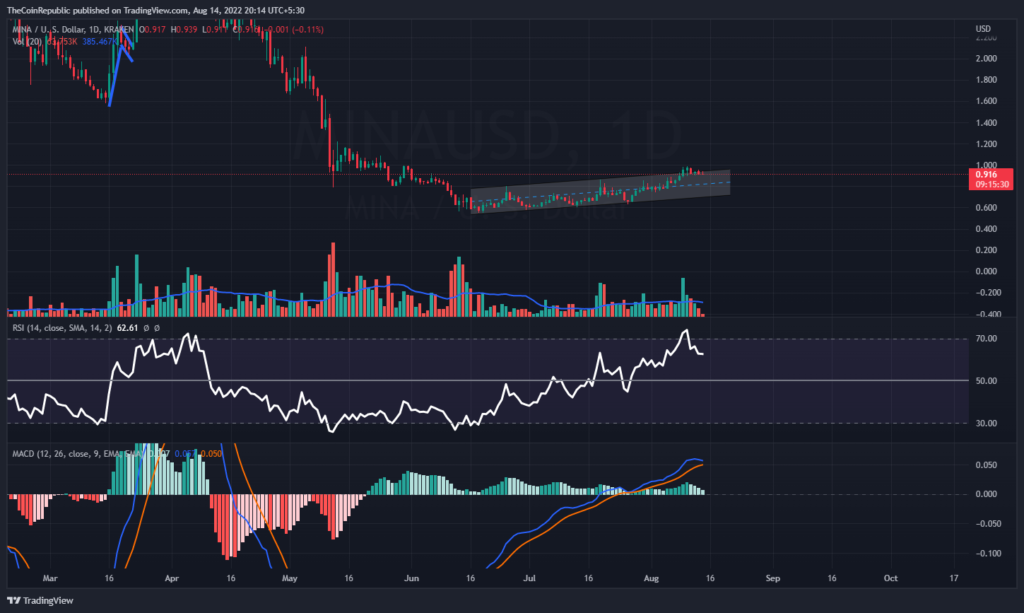
On the daily price chart, the ascending parallel channel represents the MINA cryptocurrency’s attempt to make a comeback. The token must continue to move inside the channel and push past the allowable resistance level in order to maximize recovery. Technical indicators point to the MINA coin’s declining momentum.
The relative Strength Index showcases the downtrend momentum of MINA coin. RSI is at 62 and is hovering below overbought territory. MACD exhibits the downtrend momentum of the MINA coin. The MACD line is heading towards the signal line for a negative crossover.
Conclusion
The price of mina is attempting to rise through an upward channel on the daily price chart. The coin is currently regaining as it moves upward toward the upper trendline of the channel. MINA coin has to maintain the momentum of the current rally in order to bounce back and reach a respectable barrier level. MINA bulls must maintain the upward momentum in order to allow the token to break free of the ascending parallel channel with a strong bullish surge. However, bears are making an effort to short the MINA market. The volume shift shows that the buildup of bulls is below average and that it needs to be improved if MINA is to soar. Technical indicators point to the MINA coin’s declining momentum.
Technical Levels
Support Levels: $0.88 and $0.80
Resistance Levels: $0.98 and $1.00
Disclaimer
The views and opinions stated by the author, or any people named in this article, are for informational ideas only, and they do not establish the financial, investment, or other advice. Investing in or trading crypto assets comes with a risk of financial loss.
Steve Anderson is an Australian crypto enthusiast. He is a specialist in management and trading for over 5 years. Steve has worked as a crypto trader, he loves learning about decentralisation, understanding the true potential of the blockchain.


