
 Home
Home News
News
- BNB price is trying to surge towards the upper trendline of the rising parallel channel over the daily price chart.
- BNB crypto has recovered till 20, 50 and 100-days Daily Moving Average.
- The pair of BNB/BTC is at 0.01394 BTC with an intraday gain of 2.92%.
The BNB price is increasing sharply upward on the daily price chart. The token first traded below a line with a downward slope, but was able to move out of the pattern and into the channel with an upward slope. The current increasing momentum needs to be sustained for the token to cross the daily chart. Those who want to invest in BNB must wait until the token gathers momentum and reaches a respectable resistance level. BNB currency is currently trading midway between the top and lower trendlines of the rising parallel channel. BNB bulls must provide the necessary upward momentum for the token to move toward the top trendline.
BNB price has increased 3.57% of its market capitalization in the previous 24 hours and is currently CMP at $298.2. However, during the intraday trading session, trading volume fell by 20.56%. This demonstrates that BNB now struggles to maintain bull support. Volume to market cap ratio is 0.0249.
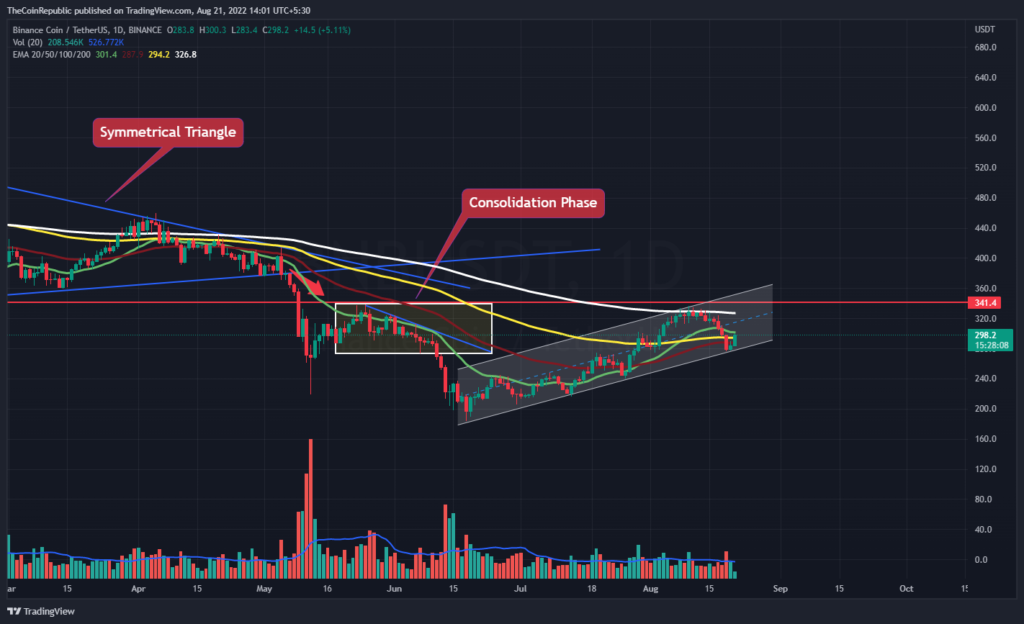
On the daily chart, the price of the BNB coin is fluctuating inside a rising parallel channel. BNB bulls need to stay close to the trendline because the coin is currently moving upstream in that direction. In order to lessen the volatility brought on by bears during the intraday trading session, the volume change of BNB coin, which is now below average, needs to improve. The BNB coin’s price has to maintain its upward pace after its breakthrough.
BNB Showcased Some Promising Factors of its Growth In Future!
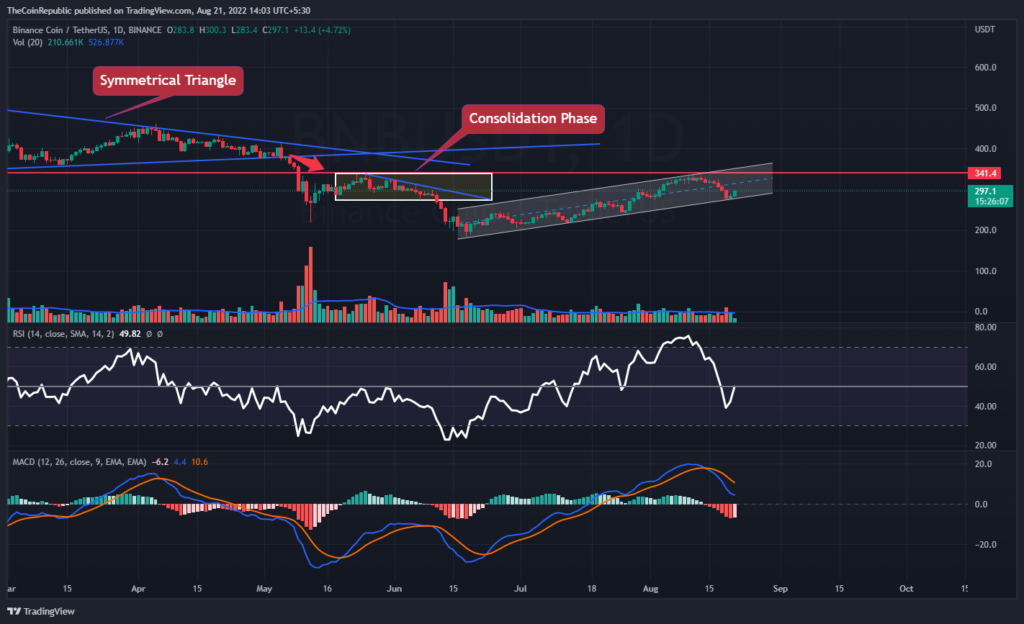
The price of the BNB coin has been fluctuating inside a rising parallel channel over the daily price chart. The token must advance toward the top trendline in order to break free of the rising pattern. Technical indications show increasing momentum for the BNB coin within the parallel channel.
The Relative Strength Index shows the BNB coin’s increasing momentum. By remaining neutral at 50, the RSI is moving closer to overbought territory. The MACD can be used to visualize the BNB coin’s consolidation period. The MACD line is beneath the signal line, however with a narrower margin. BNB investors need to keep an eye on the daily chart for any changes in trend.
Conclusion
The BNB price is increasing sharply upward on the daily price chart. The token first traded below a line with a downward slope, but was able to move out of the pattern and into the channel with an upward slope. The current increasing momentum needs to be sustained for the token to cross the daily chart. Those who want to invest in BNB must wait until the token gathers momentum and reaches a respectable resistance level. In order to lessen the volatility brought on by bears during the intraday trading session, the volume change of BNB coin, which is now below average, needs to improve. The MACD line is beneath the signal line, however with a narrower margin. BNB investors need to keep an eye on the daily chart for any changes in trend.
Technical Levels
Support Levels: $275
Resistance Levels: $300
Disclaimer
The views and opinions stated by the author, or any people named in this article, are for informational ideas only, and they do not establish the financial, investment, or other advice. Investing in or trading crypto assets comes with a risk of financial loss.

Andrew is a blockchain developer who developed his interest in cryptocurrencies while pursuing his post-graduation major in blockchain development. He is a keen observer of details and shares his passion for writing, along with coding. His backend knowledge about blockchain helps him give a unique perspective to his writing skills, and a reliable craft at explaining the concepts such as blockchain programming, languages and token minting. He also frequently shares technical details and performance indicators of ICOs and IDOs.


