
 Home
Home News
News

- Tron price has been consolidating inside the horizontal range-bound area over the daily price chart.
- TRX crypto still falters below 20, 50, 100, and 200-day Daily Moving Average.
- The pair of TRX/BTC is at 0.000003055 BTC with an intraday drop of 0.70%.
Over the course of one day, there were a number of significant changes in the price of Tron. The cryptocurrency initially entered a downward channel on the daily chart before attempting to change course inside an adjacent ascending channel. Then, as TRX entered a pattern known as a rounding bottom, another correction occurred. The token experienced a remarkable roller-coaster ride during this time. The TRX coin is now trying to maintain its upper range during the consolidation phase as the token looks for support at a higher level.

At $0.0653 CMP, Tron’s market capitalization is up 0.26% over yesterday. The transaction volume declined by 16.85% throughout the day. This shows that bears are making an effort to gather to see the token’s disintegration. The volume to market cap ratio is 0.05875.

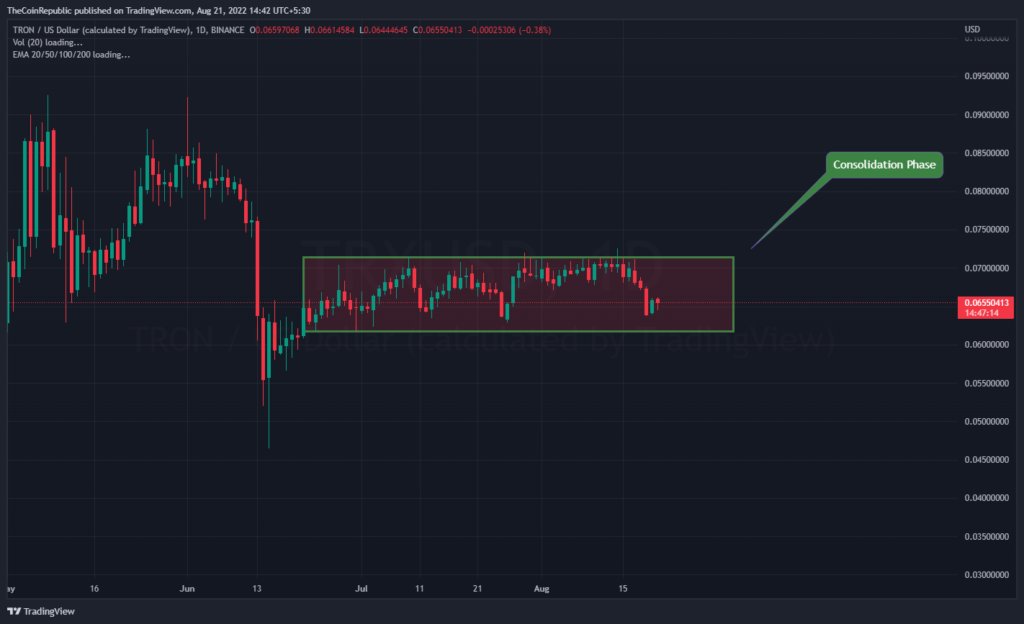
On the daily price chart, the TRX coin price is attempting to break out of the range-bound region. The price of the token is increasing, and it wants to buck the trend. The price of one TRX coin has remained constant between $0.061 and $0.070. The volume shift needs to be bigger than typical in order to move TRX outside of the range. Bears could defy the trend, though, and shift the token away from its current location.
What do Technical Indicators suggest about TRX?
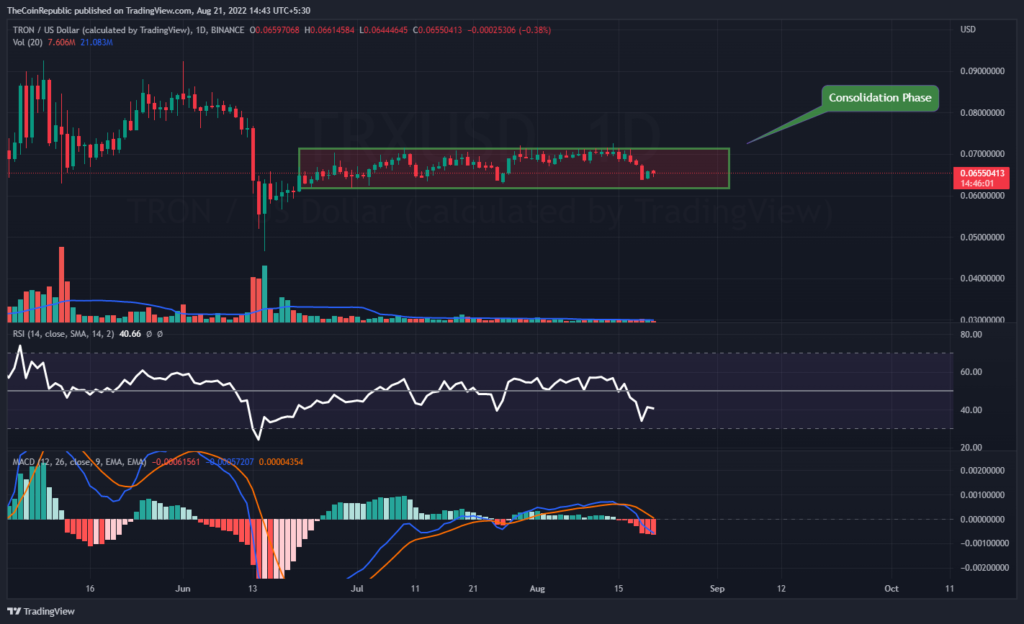
On the daily price chart, TRX is making an ascent toward the consolidation phase’s upper trendline. The cryptocurrency must build up significant bullish momentum in order to break through the range-bound area. Technical indicators point to the TRX coin’s declining momentum.
The strength of TRX’s downturn is demonstrated by the Relative Strength Index. At 40, the RSI is approaching oversold territory. The TRX coin’s bearish momentum is visible on MACD. After a negative crossover, the MACD line is lower than the signal line. Investors in TRX must watch the daily chart for any directional changes.
Conclusion
Over the course of one day, there were a number of significant changes in the price of Tron. The cryptocurrency initially entered a downward channel on the daily chart before attempting to change course inside an adjacent ascending channel. Then, as TRX entered a pattern known as a rounding bottom, another correction occurred. The token experienced a remarkable roller-coaster ride during this time. The volume shift needs to be bigger than typical in order to move TRX outside of the range. Bears could defy the trend, though, and shift the token away from its current location. Technical indicators point to the TRX coin’s declining momentum. After a negative crossover, the MACD line is lower than the signal line. Investors in TRX must watch the daily chart for any directional changes.
Technical Levels
Support Level: $0.063 and $0.060
Resistance Level: $0.067 and $0.070
Disclaimer
The views and opinions stated by the author, or any people named in this article, are for informational ideas only, and they do not establish the financial, investment, or other advice. Investing in or trading crypto assets comes with a risk of financial loss.
Steve Anderson is an Australian crypto enthusiast. He is a specialist in management and trading for over 5 years. Steve has worked as a crypto trader, he loves learning about decentralisation, understanding the true potential of the blockchain.


