
 Home
Home News
News

- With more people selling the token, the RUNE price, which had been moving in a sideways trend for a while, is suddenly declining.
- The technical indicators are bending over the bears, as dominated by the BTC.
- The RUNE/BTC pair is at 0.0001106 BTC which is at a loss of 1.44%.
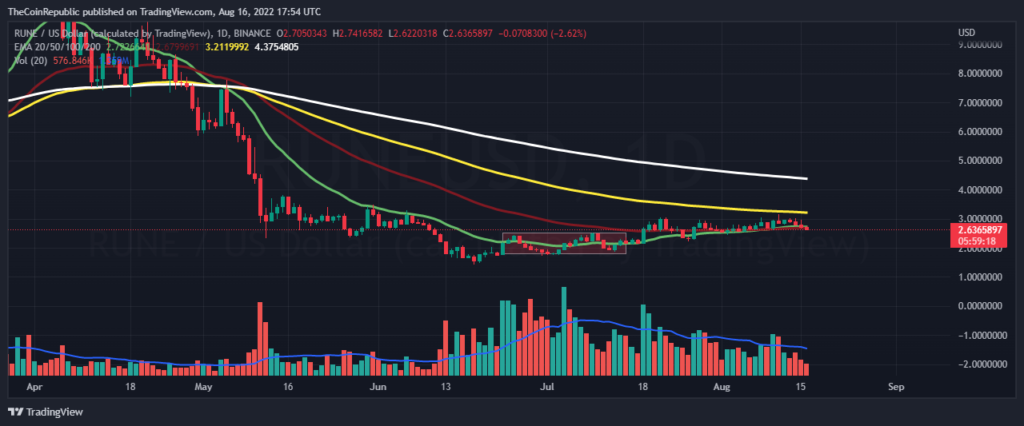
The RUNE price trading on a sideways trend for a long term is now falling amid the increase in selling over the token. The selling pressure is making the token to rally bearishly and if the situation persists the token will adapt to a downtrend movement over the daily price chart.

A major reason behind this bearish rally is the domination by the traditional cryptocurrency, Bitcoin. The BTC price is sinking after hitting a resistance of 25200 USD and is making pressure on the rest of the market. The trading volume is at a decrease of 18.32% and needs an uplift which in turn will help the price to climb over the chart. While the analysts believe the token may fall further and warn the investors about the same.

The current price for one RUNE token is hovering at $2.64 with a loss of 2.77% in its market capitalization in the last 24 hrs. The coin has a trading volume of 97 million which is at a huge loss of 18.17% in the 24 hrs trading session and has a market cap of 872 million with a loss of 2.7%. The volume market cap ratio is 0.1121.
What do Technical Indicators Suggest for RUNE?
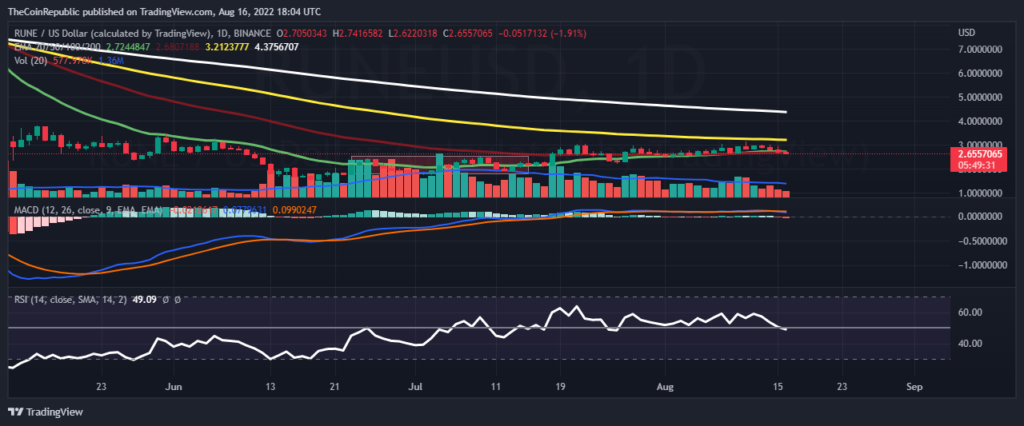
The price is falling continuously even after a positive cross over the daily price chart and now the lines are preparing for a negative cross.
The MACD indicator gave a fresh negative cross and now the MACD line is moving below the MACD signal line which supports the dominance of the sellers over the market along with the histograms dropping red. The relative strength index is diving continuously amid this increase in sellings over the token. The RSI value is moving below 50.
Conclusion
The RUNE price trading on a sideways trend for a long term is now falling amid the increase in selling over the token. The BTC price is sinking after hitting a resistance of 25200 USD and is making pressure on the rest of the market. Technical indicators support a negative movement across short and long time horizons and the analysts believe the coin may fall further and warn the investors of the same.
Technical levels
Resistance levels: $3.15 and $3.83
Support levels: $2.23 and $1.80.
Disclaimer
The views and opinions stated by the author, or any people named in this article, are for informational ideas only, and they do not establish the financial, investment, or other advice. Investing in or trading crypto assets comes with a risk of financial loss.

Nancy J. Allen is a crypto enthusiast, with a major in macroeconomics and minor in business statistics. She believes that cryptocurrencies inspire people to be their own banks, and step aside from traditional monetary exchange systems. She is also intrigued by blockchain technology and its functioning. She frequently researches, and posts content on the top altcoins, their theoretical working principles and technical price predictions.


