
 Home
Home News
News
- Nexo price must escape the consolidation phase over the daily price chart.
- NEXO crypto has recovered above 20, 50 and 100-days Daily Moving Average but still behind 200-DMA.
- The pair of NEXO/BTC is at 0.00004487 BTC with an intraday gain of 2.25%.
The price of NEXO underwent a lot of substantial adjustments in the course of a single day. Prior to attempting to reverse course inside the consolidation phase, the cryptocurrency initially established a downward trend on the daily chart. In the interim, the token went on an amazing roller-coaster trip. As the token searches for support at a higher level during the consolidation phase, the NEXO currency is currently attempting to retain its upper range. Bulls on Nexo must gather in order to observe the token’s exit from the consolidation stage.
Nexo’s market value increased by 2.52% from yesterday to $0.0653 CMP. Over the course of the day, the transaction volume has considerably increased by 142%. This demonstrates that bulls are making an effort to congregate to watch the integration of the token. The volume to market cap ratio is 0.09232.
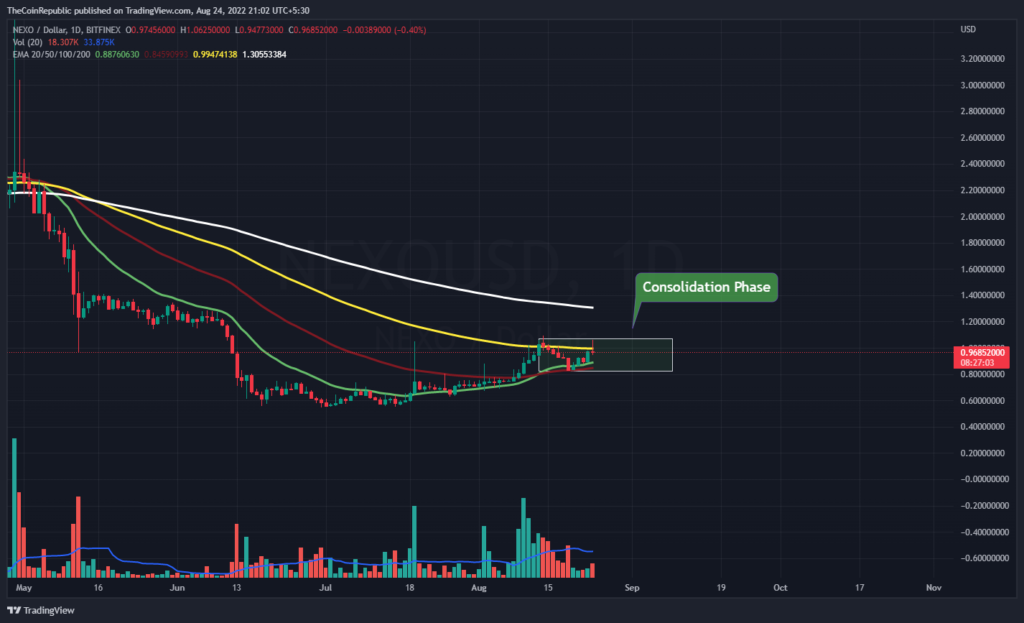
On the daily price chart, the price of the NEXO coin is attempting to exit the range-bound area. The token aims to defy the trend and decrease in price. A single NEXO coin has always cost between $0.80 and $1.05. To move NEXO outside of the range, a larger-than-normal volume shift is required. However, bears could buck the trend and move the token from its present position.
Will NEXO Recover Itself Back from the Range?
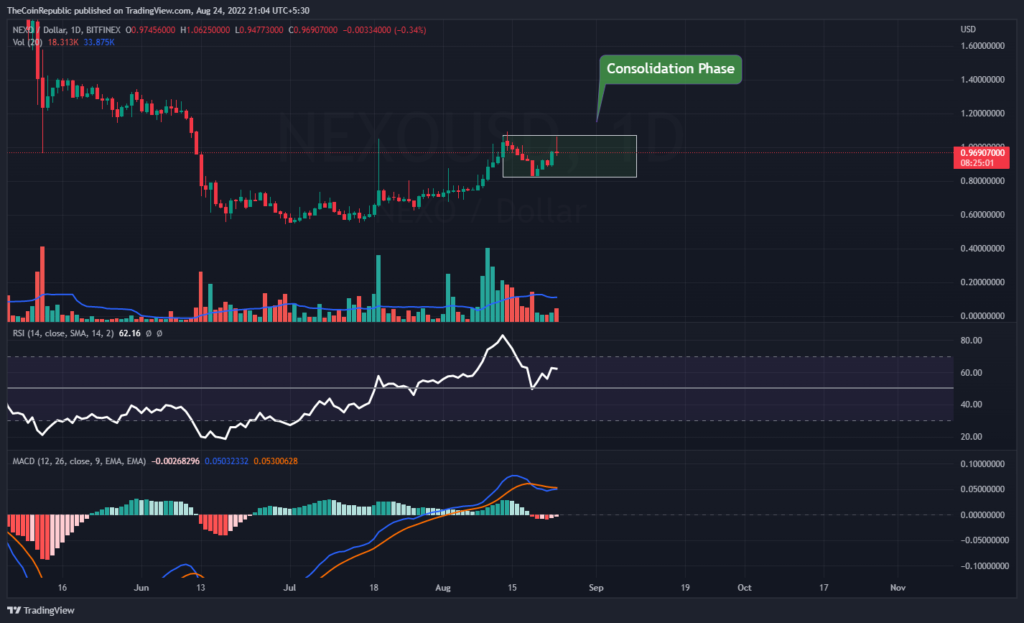
NEXO is climbing near the top trendline of the consolidation period on the daily price chart. For the cryptocurrency to penetrate the range-bound region, it has to have strong bullish momentum. The sideways movement of the NEXO coin is shown by technical indicators.
The Relative Strength Index shows how strong NEXO’s sideways are. The RSI is barely above neutrality at 62. On MACD, the positive momentum of the NEXO coin is apparent. The signal line upward and the MACD line are going to intersect. Investors in NEXO must keep an eye on the daily chart for any changes in trend.
Conclusion
The price of NEXO underwent a lot of substantial adjustments in the course of a single day. Prior to attempting to reverse course inside the consolidation phase, the cryptocurrency initially established a downward trend on the daily chart. In the interim, the token went on an amazing roller-coaster trip. As the token searches for support at a higher level during the consolidation phase, the NEXO currency is currently attempting to retain its upper range. The token aims to defy the trend and decrease in price. A single NEXO coin has always cost between $0.80 and $1.05. To move NEXO outside of the range, a larger-than-normal volume shift is required. The sideways movement of the NEXO coin is shown by technical indicators. The signal line upward and the MACD line are going to intersect. Investors in NEXO must keep an eye on the daily chart for any changes in trend.
Technical Levels
Support Level: $0.88 and $0.80
Resistance Level: $1.05 and $1.10
Disclaimer
The views and opinions stated by the author, or any people named in this article, are for informational ideas only, and they do not establish the financial, investment, or other advice. Investing in or trading crypto assets comes with a risk of financial loss.

Nancy J. Allen is a crypto enthusiast, with a major in macroeconomics and minor in business statistics. She believes that cryptocurrencies inspire people to be their own banks, and step aside from traditional monetary exchange systems. She is also intrigued by blockchain technology and its functioning. She frequently researches, and posts content on the top altcoins, their theoretical working principles and technical price predictions.


