
 Home
Home News
News
- XDC Network price is trading with downtrend momentum inside the consolidation phase.
- XDC crypto is trading at 20 and 50 EMA but still below 100 and 200-days Daily Moving Average.
- The pair of XDC/BTC is at 0.000001437 BTC with an intraday drop of 0.79%.
Over the course of one day, there were numerous significant changes in the pricing of XDC Network. The cryptocurrency first developed a negative trend on the daily chart before attempting to change direction inside the consolidation phase. The token then embarked on an incredible roller-coaster journey. The XDC currency is now trying to hold its upper range as the token hunts for support at a higher level during the consolidation phase. Bulls on XDC must assemble to watch the token leave the consolidation phase.

The market value of XDC Network fell by 0.30% from yesterday to $0.03080 CMP. The amount of transactions has significantly fallen by 23.22% throughout the day. This suggests that bears are attempting to group together to watch the token’s destruction. The volume to market cap ratio is 0.02638.

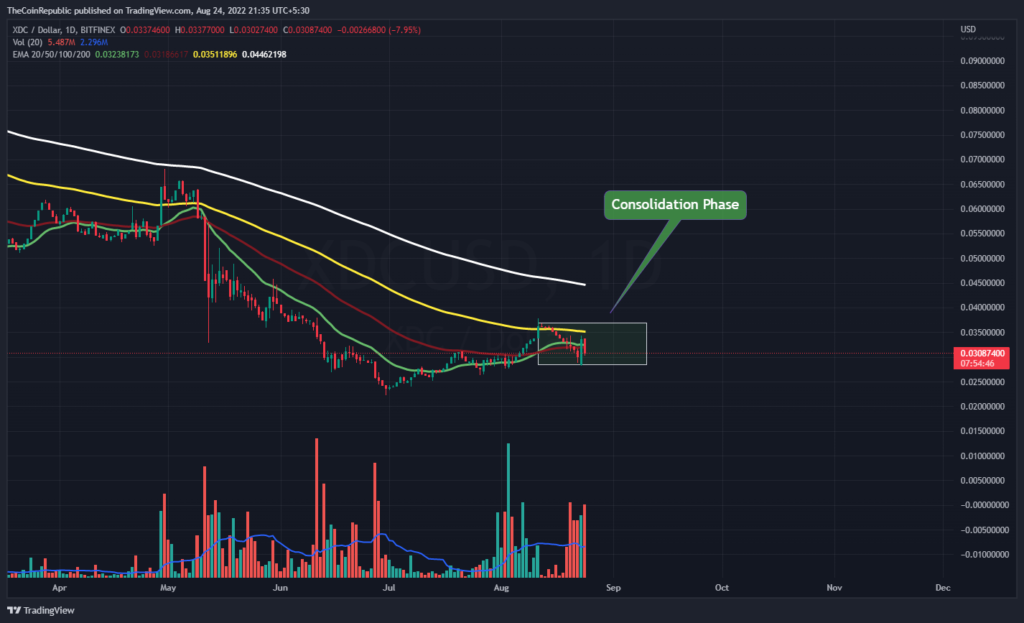
The price of the XDC coin is striving to leave the range-bound region on the daily price chart. The token wants to buck the trend and become cheaper. The price of a single XDC coin has always ranged from $0.028 to $0.035. A larger-than-average volume change is needed to move XDC outside of the range. Bears might defy the trend, though, and move the token farther from where it is now.
What do Technical Indicators suggest about XDC?
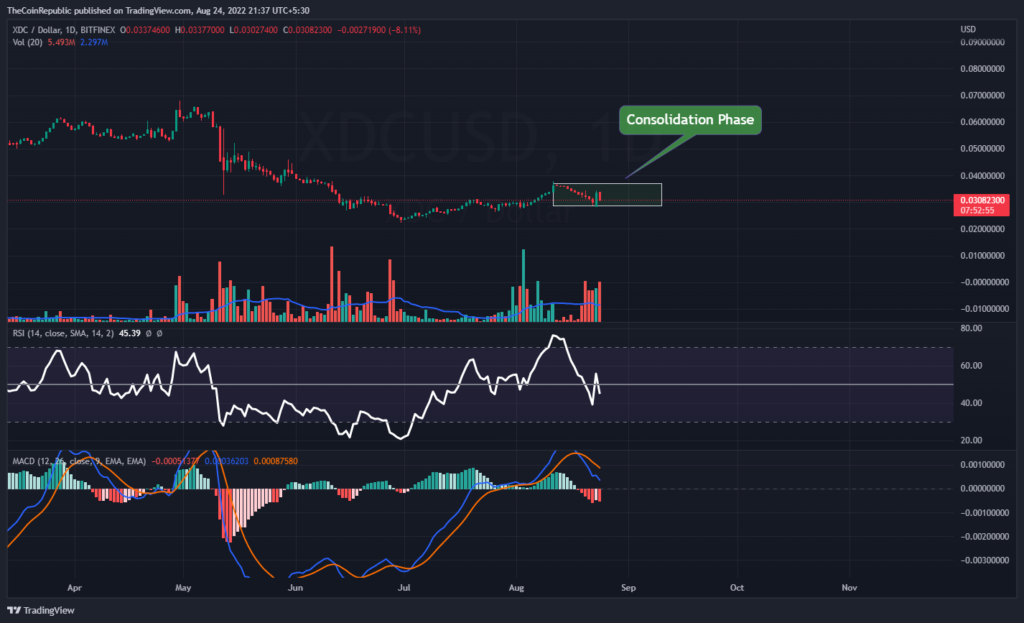
On the daily price chart, XDC is advancing close to the top trendline of the consolidation phase. The cryptocurrency needs to be moving strongly in the bullish direction in order to break through the range-bound area. Technical indications demonstrate the XDC coin’s downtrend movement.
The XDC coin’s momentum in the downturn is displayed by the Relative Strength Index. At 45, the RSI is approaching oversold territory. The MACD displays the XDC cryptocurrency’s decline momentum. After a negative crossover, the MACD line is lower than the signal line. XDC investors need to monitor the daily chart for any shifts in trend.
Conclusion
Over the course of one day, there were numerous significant changes in the pricing of XDC Network. The cryptocurrency first developed a negative trend on the daily chart before attempting to change direction inside the consolidation phase. The token then embarked on an incredible roller-coaster journey. The XDC currency is now trying to hold its upper range as the token hunts for support at a higher level during the consolidation phase. A larger-than-average volume change is needed to move XDC outside of the range. Bears might defy the trend, though, and move the token farther from where it is now. Technical indications demonstrate the XDC coin’s downtrend movement. After a negative crossover, the MACD line is lower than the signal line. XDC investors need to monitor the daily chart for any shifts in trend.
Technical Levels
Support Level: $0.028 and $0.025
Resistance Level: $0.035 and $0.040
Disclaimer
The views and opinions stated by the author, or any people named in this article, are for informational ideas only, and they do not establish the financial, investment, or other advice. Investing in or trading crypto assets comes with a risk of financial loss.

Nancy J. Allen is a crypto enthusiast, with a major in macroeconomics and minor in business statistics. She believes that cryptocurrencies inspire people to be their own banks, and step aside from traditional monetary exchange systems. She is also intrigued by blockchain technology and its functioning. She frequently researches, and posts content on the top altcoins, their theoretical working principles and technical price predictions.


