
 Home
Home News
News
- The EVMOS coin shows a slight improvement after forming a symmetrical triangle pattern.
- The daily RSI indicator is showing a positive signal for an uptrend.
- The EVMOS coin belonging to the bitcoin pair is under the green zone at 0.0001264 satoshis, up 5.4%.
Evmos coin has trapped the bears if they ignore the given triangle pattern. The price gradually rises from its monthly low with a few sideways trading sessions. The market capitalization is also rising with the uptrend but the bears still don’t want to lose their hope.

Evmos coin has remained above the above trend line for the past several days as buyers continue to buy dips. As a result, the altcoin gained 48.3% last month. The month also started with an upward movement which may continue till the price reaches a downsloping trendline.

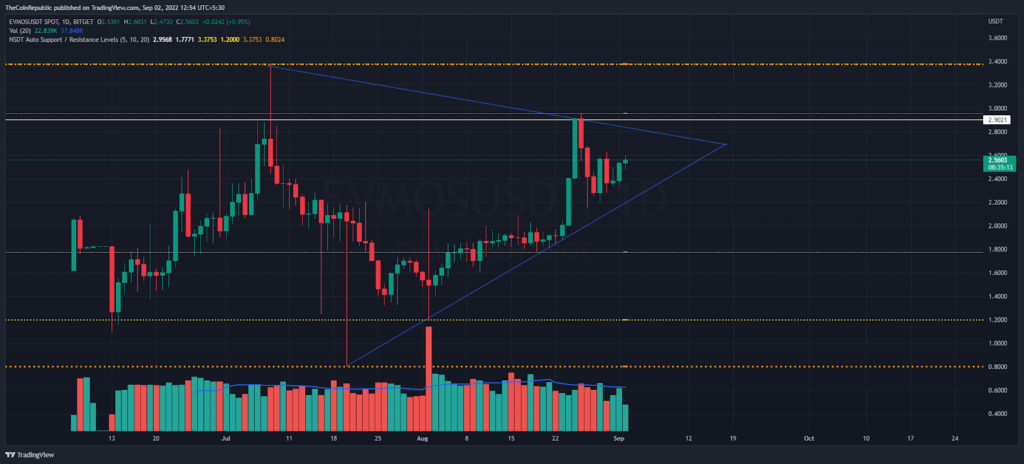
In a lower time frame, crypto is looking bullish and makes higher-lows formation. Thus, it is trading at $2.5 Mark against USDT, at press time. The EVMOS coin has made five bullish candles over the weekly time frame. Furthermore, the EVMOS coin concerning the Bitcoin pair is under green zone by 5.4% at 0.0001264 Satoshis.
Bulls have a vital hedge zone at $2.3 mark if price turns lower ahead. On the flip side, the round level of $3.0 stood to be a key selling point for bears. However, trading volume suggests volatility in EVMOS coin at $2.5 Million in the last 24-hours.
MACD May Display Sideways Move Next Week
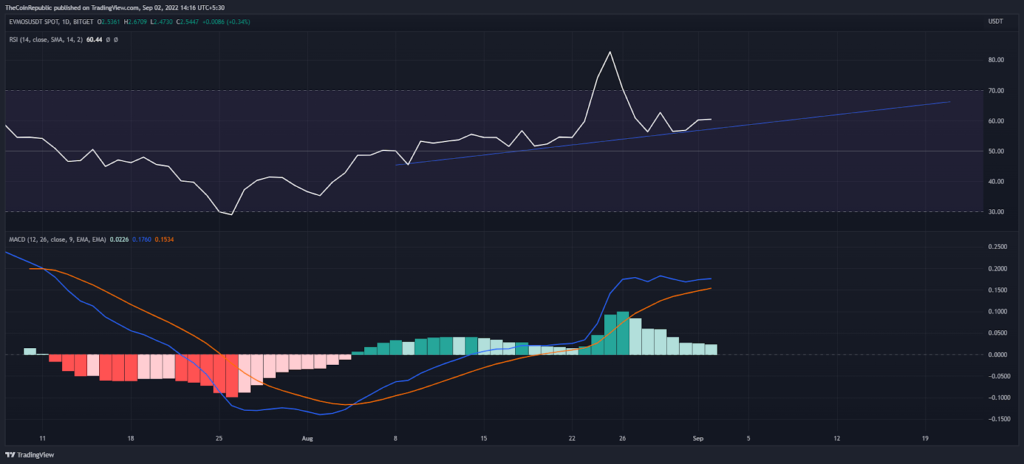
In the context of the daily price scale, the RSI indicator remains above the uptrend line after it remains above the semi-line. Furthermore, the MACD moves higher in positive territory, but has less space between the moving lines of the month than on other days.
Conclusion
The EVMOS is in recovery mode after completing the recent retracement phase. Buyers may not see a spike unless the price remains in a symmetrical triangle pattern on the daily price scale.
Support level – $2.0 and 1.0
Resistance level – $3.0 and $5.0
Disclaimer
The views and opinions stated by the author, or any people named in this article, are for informational ideas only, and they do not establish financial, investment, or other advice. Investing in or trading crypto assets comes with a risk of financial loss.

Nancy J. Allen is a crypto enthusiast, with a major in macroeconomics and minor in business statistics. She believes that cryptocurrencies inspire people to be their own banks, and step aside from traditional monetary exchange systems. She is also intrigued by blockchain technology and its functioning. She frequently researches, and posts content on the top altcoins, their theoretical working principles and technical price predictions.


