
 Home
Home News
News

- AMP price is looking for a support to register its recovery phase over teh daily price chart.
- AMP crypto stands at 116th position on CoinMarketCap and is currently approximated at $0.00605.
- The pair of AMP/BTC is at 0.0000003052 BTC with an intraday gain of 1.26%.
Over the daily chart, the price of AMP is declining inside a descending triangle pattern. The token is being pushed upward by AMP bulls. Bears are attempting to pull the token for a breakdown, though. Investors in AMP must watch the daily chart for any directional changes. The circumstances of the prolonged bear market are the reason why AMP currency has been declining for so long. As Bitcoin struggles to maintain the rising momentum in order to exit the consolidation phase, it is currently slipping below the psychological mark of $30000. The other altcoins started surging bearishly over the chart as they also struggled to attract buyers.

The current CMP price of AMP is $0.00605, and in the previous day, it lost 0.55% of its market value. However, during the intraday trading session, trading volume increased by 5.72%. This demonstrates that bears are currently in charge of AMP’s trade, and bulls must build up to prevent AMP from collapsing. Volume to market cap ratio is 0.02426.

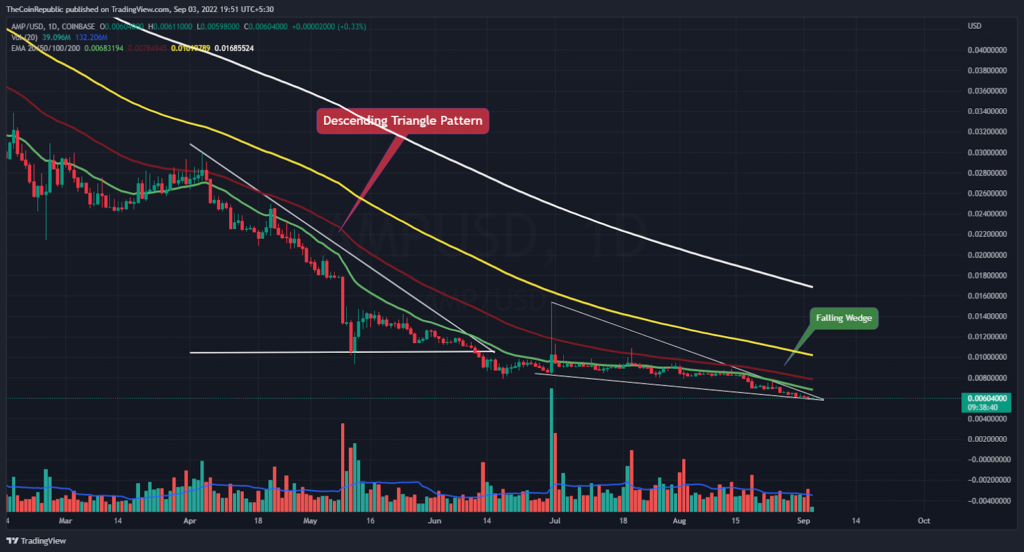
Over the daily chart, the AMP coin price is attempting to build a strong rising momentum. Through a series of descending triangles, the token has been falling. Red volume bars indicate that AMP is being held inside the falling pattern. To break the pattern, the token needs to gain support from existing customers and draw in more. Bears, however, are currently in control and seeking to record the token’s disintegration.
The price of AMP coin is currently in a critical make-or-break situation, and bulls must advance to prevent further price correction.
When will AMP Return from Oversold Territory?
The price of AMP is attempting to break free of the descending triangle pattern. Currently, the token is trading in a dire condition that might either make or break it. To avoid falling into the bearish trap, AMP must break free of the pattern. Technical indicators point to AMP coin’s demise.
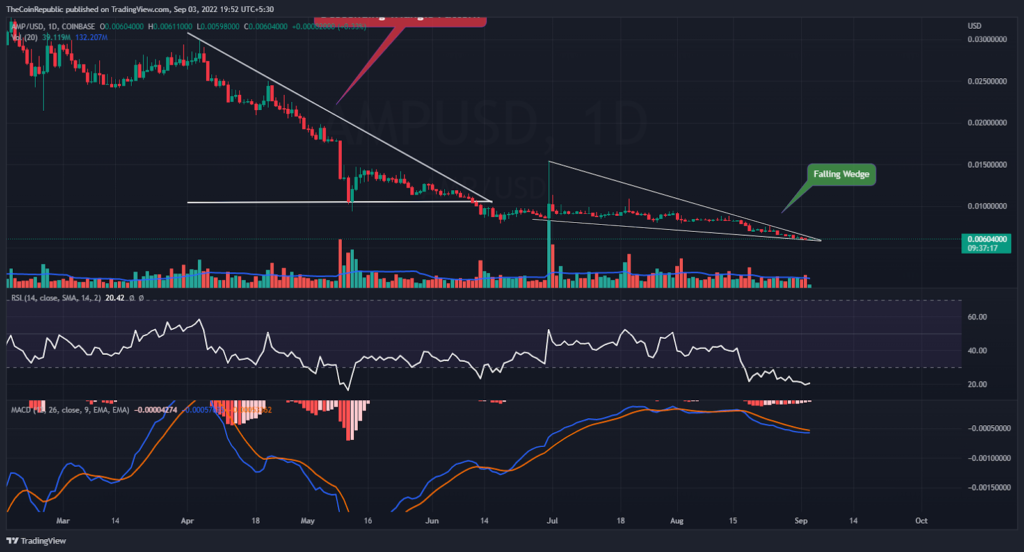
According to the Relative Strength Index, AMP is attempting to recover from an oversold area. Since it hasn’t indicated for so long, the RSI, which is at 20 and trying to recover, may be observed below a downward trendline. Investors in AMP can anticipate any direction change as soon as the token exits the oversold zone. MACD exhibits the consolidation phase of AMP coin. The MACD line is below the signal line.
Conclusion
Over the daily chart, the price of AMP is declining inside a descending triangle pattern. The token is being pushed upward by AMP bulls. Bears are attempting to pull the token for a breakdown, though. Investors in AMP must watch the daily chart for any directional changes. The circumstances of the prolonged bear market are the reason why AMP currency has been declining for so long. As Bitcoin struggles to maintain the rising momentum in order to exit the consolidation phase, it is currently slipping below the psychological mark of $30000. Technical indicators point to AMP coin’s demise. According to the Relative Strength Index, AMP is attempting to recover from an oversold area.
Technical Levels
Support Level: $0.0055
Resistance Level: $0.0065
Disclaimer
The views and opinions stated by the author, or any people named in this article, are for informational ideas only, and they do not establish the financial, investment, or other advice. Investing in or trading crypto assets comes with a risk of financial loss.

With a background in journalism, Ritika Sharma has worked with many reputed media firms focusing on general news such as politics and crime. She joined The Coin Republic as a reporter for crypto, and found a great passion for cryptocurrency, Web3, NFTs and other digital assets. She spends a lot of time researching and delving deeper into these concepts around the clock, and is a strong advocate for women in STEM.


