
 Home
Home News
News

- The ETC coin price is bullish after it broke the important supply zone recently.
- The ETC coin price is forming a falling wedge pattern on a daily time frame.
- The pair of ETC/BTC is trading at the price level of 0.001617 with a decrease of 0.67% in the past 24 hours.
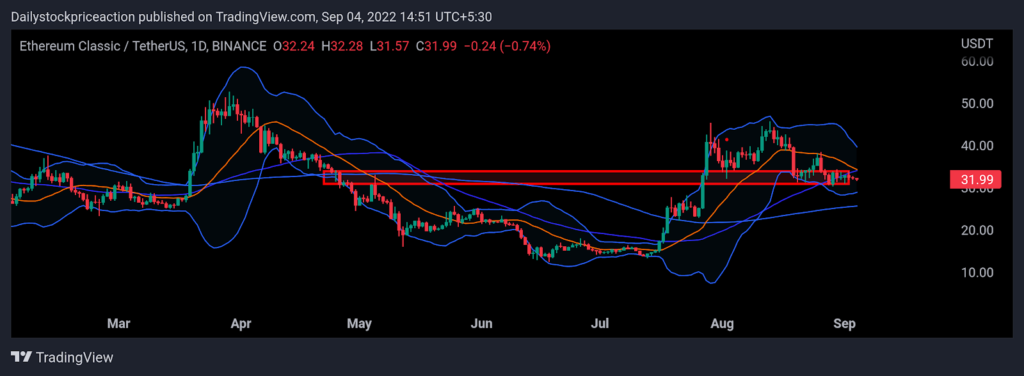
The ETC coin price, as per the price action, is super bullish after breaking the important supply zone. As of now, the coin price is resting at the long-term supply zone turned demand zone. The ETC coin price is forming lower low and lower high formation on a smaller time frame. But on a larger time frame, the coin price is forming higher highs and higher low price structures. At present, the coin price has fallen back to the demand zone after facing the bearish pressure of the global markets. Recent bearish pressure seems to have not affected much as the coin price has managed to sustain about the breakout zone. This fall in the price of ETC coin could just be the greatest before the further bullish move. Currently, the ETC coin price is trading above the 50 and 100 Moving Averages. Break out of the supply zone had resulted in the coin price moving above the 50 and 100 MAs. Moving upwards the coin price van is seen resting at these MAs. At present, the ETC coin price is trading in the middle of the Bollinger band indicator after facing bearish pressure from the upper band. Volumes have increased due to recent falls and therefore investors should remain cautious and wait for a proper signal.

The ETC coin price is forming a falling wedge pattern on a daily time frame
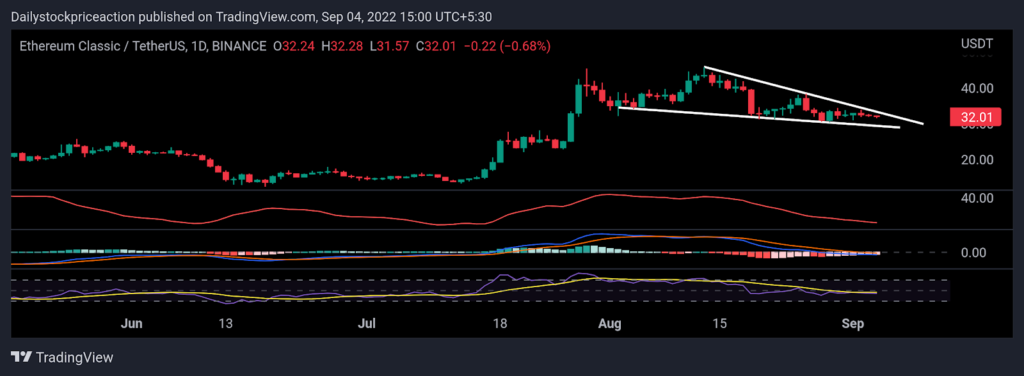
Relative Strength Index: The RSI curve has dropped below the halfway mark of 50 as the coin price fell to the demand zone. The ETC coin price as per the price action is bearish and the same as depicted in the RSI curve. The RSI curve is currently transacting at 31.78, after dipping out of the 25 mark. As of now, the RSI curve has also gone past the 20 EMA, indicating some bullishness signs. If the coin price successfully bounces off the demand zone, the RSI curve can be seen moving higher supporting the trend.

Moving Average Convergence Divergence: The ETC coin price is bearish as it fell to the breakout zone in a smaller time frame. Currently, as it rests at the demand zone, the MACD indicator has given a negative crossover. The orange line crossed the blue line on the upside. If the coin price fails to sustain above the demand zone, then the fall in the price of the ETC coin can result in the MACD line widening supporting the trend.
Average Directional Movement Index: ADX curve has been dipping on a higher time frame as the coin fell. In a daily time frame, the ADX curve has dipped out of the 20 mark and has turned upwards. As the coin price rests at the short-term demand zone on a 4-hour time frame. It is a positive sign for the coin price. Investors should wait for a positive candle formation at the demand zone.
CONCLUSION: The ETC coin price is bullish as it forms a bullish chart pattern over a 4 hour time frame. As the technical parameters suggest, the coin price can be seen breaking the demand zone if bulls fail to power it up. It remains to see if the coin price will break the demand zone, or bounce off it breaking the falling wedge pattern on a daily time frame.
SUPPORT: $30 and $29
RESISTANCE: $43 and $47

Nancy J. Allen is a crypto enthusiast, with a major in macroeconomics and minor in business statistics. She believes that cryptocurrencies inspire people to be their own banks, and step aside from traditional monetary exchange systems. She is also intrigued by blockchain technology and its functioning. She frequently researches, and posts content on the top altcoins, their theoretical working principles and technical price predictions.


