
 Home
Home News
News

- EOS price is trying to consolidate inside the horizontal range bound area over the daily chart.
- EOS crypto is trading at 20 and 50-EMA and is still behind 200-days DMA.
- The pair of EOS/BTC is at 0.00007446 BTC with an intraday drop of 3.03%.
The price of the EOS has remained stable inside a range-bound band ever since August 14th. This existential crisis led to panic selling on the cryptocurrency market. In spite of the extreme volatility of the cryptocurrency, investors are trying to hang onto their own assets. EOS is one of the digital currencies experiencing an existential crisis as it teeters at a record low. During this turbulent moment, cryptocurrency investors need to be as rock-solid as those with diamond hands. Diamond hands won’t be as eager to sell their holdings as other players.

EOS is currently trading at $1.48 on the CMP, a decrease in market value of 2.58% from the previous day. However, the trade volume has dropped by 49.04% during intraday trading. The inference is that users are getting in touch with businesses to withdraw EOS money. Volume to market cap ratio is 0.1545.

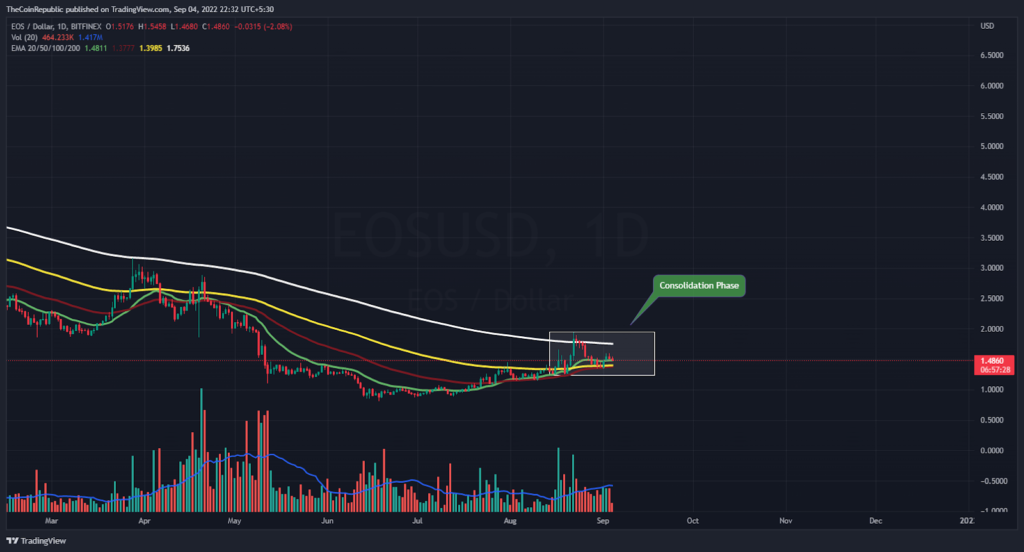
On the daily price chart, the price of the EOS coin is clearly declining. Due to the market’s ongoing deterioration, the cryptocurrency asset has reverted to the consolidation phase close to the 2020 lows. If the price of the EOS currency is to increase back to the upper price range of the consolidation period, more buyers must enter the market. The cost of EOS has been holding steady between $1.25 and $1.95. The volume change, which is now low compared to average, needs to increase for EOS currency to cross the daily chart.
What do Technical Indicators suggest about EOS?
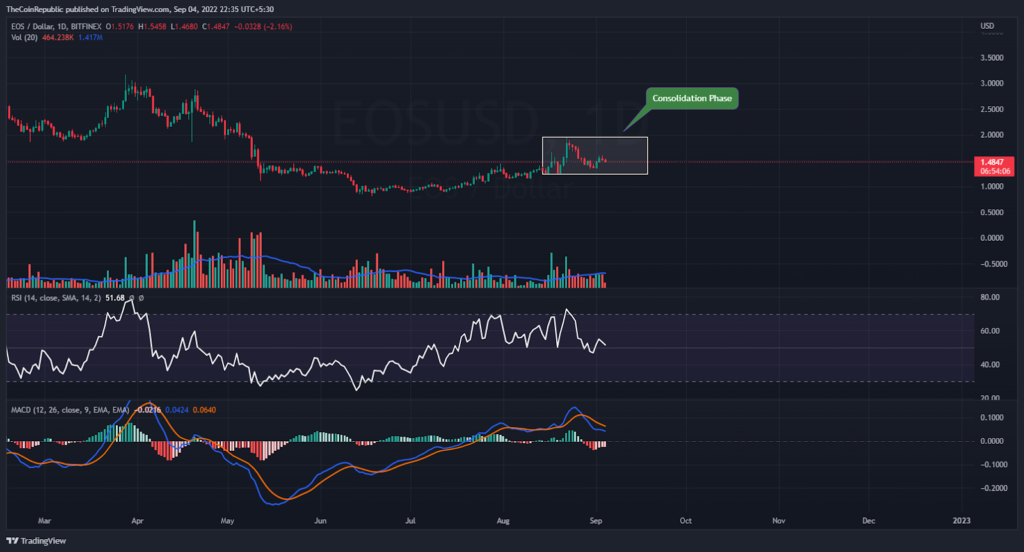
On the daily price chart, the price of EOS is rapidly decreasing. For the EOS coin to move quickly toward the top price range of the consolidation phase, it has to attract support from buyers. The strength of the downward trend for the EOS coin is demonstrated by technical indicators.
The EOS coin’s fall is indicated by the relative strength index (RSI). At 53, the RSI is about to leave neutrality. For the EOS cryptocurrency, the MACD displays a bearish momentum. After a negative crossover, the MACD line is lower than the signal line. Investors in EOS should monitor the daily chart for any shifts in trend.
Conclusion
The price of the EOS has remained stable inside a range-bound band ever since August 14th. This existential crisis led to panic selling on the cryptocurrency market. In spite of the extreme volatility of the cryptocurrency, investors are trying to hang onto their own assets. EOS is one of the digital currencies experiencing an existential crisis as it teeters at a record low. The cost of EOS has been holding steady between $1.25 and $1.95. The volume change, which is now low compared to average, needs to increase for EOS currency to cross the daily chart. The strength of the downward trend for the EOS coin is demonstrated by technical indicators. After a negative crossover, the MACD line is lower than the signal line. Investors in EOS should monitor the daily chart for any shifts in trend.
Technical Levels
Support Level: $1.35 and $1.25
Resistance Level: $1.75 and $1.95
Disclaimer
The views and opinions stated by the author, or any people named in this article, are for informational ideas only, and they do not establish the financial, investment, or other advice. Investing in or trading crypto assets comes with a risk of financial loss.
Steve Anderson is an Australian crypto enthusiast. He is a specialist in management and trading for over 5 years. Steve has worked as a crypto trader, he loves learning about decentralisation, understanding the true potential of the blockchain.


