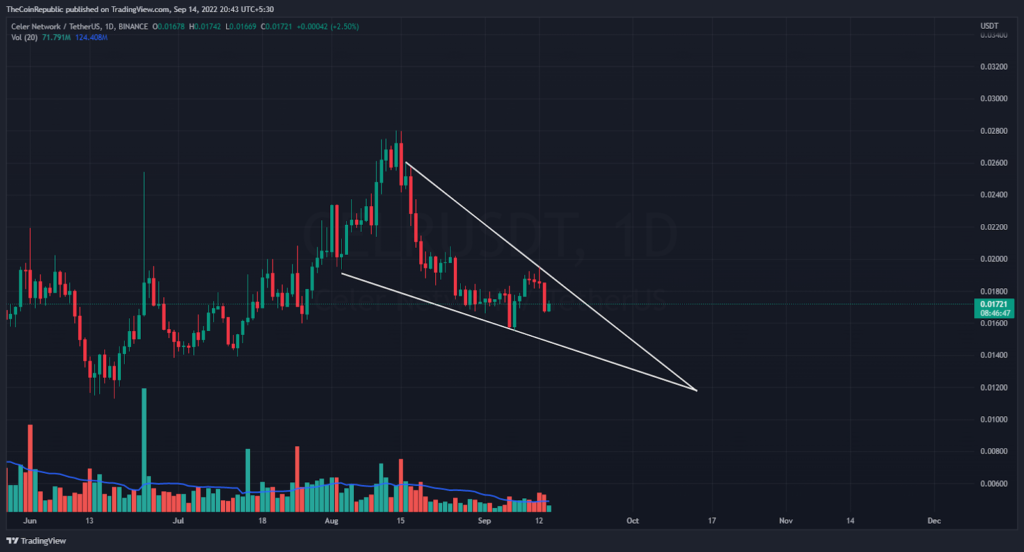
- Celer Network Price has been declining through a falling wedge pattern over daily chart.
- CELR coin is below 20, 50, 100 and 200 daily moving average.
- The pair of CELR/BTC is at 0.0000008409 BTC with an intraday gain of 3.97%.
The CELR coin has been in a falling wedge pattern in the intraday chart. CELR coin rises from september low of 0.01571 and reached an upper trendline at 001928. After reaching the upper trendline bears took over the game and pull the price action towards the lower trendline. Buyers must approach to rescue the token from falling wedge pattern. However bears may try to register the tokens breakdown.
CELR currently is at $0.01695 with an intraday loss of 7.48%. Trading volume has declined by 23.10% in the intraday trading session. This indicates that sellers are trying to grapple the token for a breakdown. Volume to market cap ratio of 0.07767.

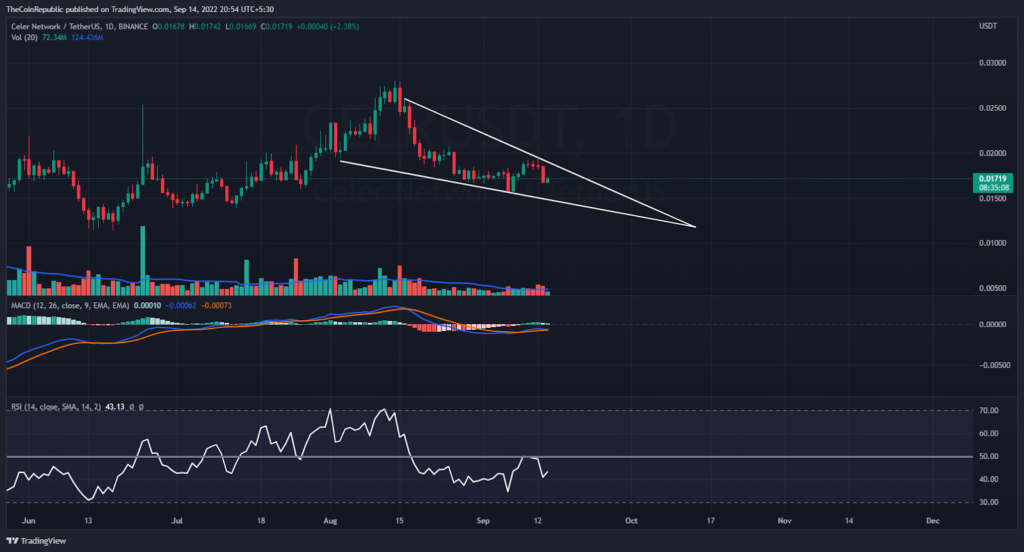
On the daily price chart, the CELR coin price stumbles before steadily gaining upward speed. On the daily price chart, the token is reversing from the upper trendline and continuing to down through a falling wedge pattern. In order to break out of the falling wedge formation, CELR urgently needs to draw in more purchasers. However, the volume change is below average and must increase for CELR to recover.
What do Technical Indicators suggest about CELR?

Over the daily price chart, the CELR coin price is attempting to hold at the upper trendline of the falling wedge pattern. The coin is signaling a return from the upper trendline and attempting to gain support from buyers. According to technical indicators, CELR is currently in a decline while forming a falling wedge pattern.
The upward momentum of the CELR coin is displayed by the relative strength index. Investors in CELR must now watch for any directional movement on the daily price chart to determine the momentum of the CELR coin as the RSI is at 43 and is currently below neutrality.
The momentum of the CELR coin’s fall is visible on MACD. In preparation for a negative crossover, the MACD line is moving near the signal line.
Conclusion
CELR coin has been in a falling wedge pattern in the intraday chart. CELR coin rose from its September low of 0.01571 and reached an upper trendline at 001928. After reaching the upper trendline bears took over the game and pulled the price action towards the lower trendline. Buyers must approach to rescue the token from falling wedge patterns. In order to break out of the falling wedge formation, CELR urgently needs to draw in more purchasers. However, the volume change is below average and must increase for CELR to recover. The momentum of the CELR coin’s fall is visible on MACD. In preparation for a negative crossover, the MACD line is moving near the signal line.
Technical Levels
Support Level: $0.015
Resistance Level: $0.018
Disclaimer
The views and opinions stated by the author, or any people named in this article, are for informational ideas only, and they do not establish the financial, investment, or other advice. Investing in or trading crypto assets comes with a risk of financial loss.

Nancy J. Allen is a crypto enthusiast, with a major in macroeconomics and minor in business statistics. She believes that cryptocurrencies inspire people to be their own banks, and step aside from traditional monetary exchange systems. She is also intrigued by blockchain technology and its functioning. She frequently researches, and posts content on the top altcoins, their theoretical working principles and technical price predictions.


 Home
Home News
News


