
 Home
Home News
News

- Fantom Coin registered a lower-high formation below a bearish trend line.
- The weekly ADX is standing below the 20 zones on the daily price scale.
- The FTM coin is trading above the upper band of the Bollinger Bands indicator.
Fantom price analysis shows sideways movement after a sharp decline. Later, the FTM coin moved in a broad horizontal range of support and resistance at $0.42 and $0.24 for the past several weeks. In this wide range, buyers keep getting rejections on every bounce. Thus, the coin is trading near the support line.

At the time of writing, FTM Coin is trading at the $0.246 mark against the USDT pair. Bears dominated the altcoin price last month, resulting in a 16.8% drop in the coin. Later buyers struggled again this month, with the price falling by 9.86% so far. Furthermore, Fantom Coin is up a little over 1.3% at 0.00001242 satoshis with the bitcoin pairing.

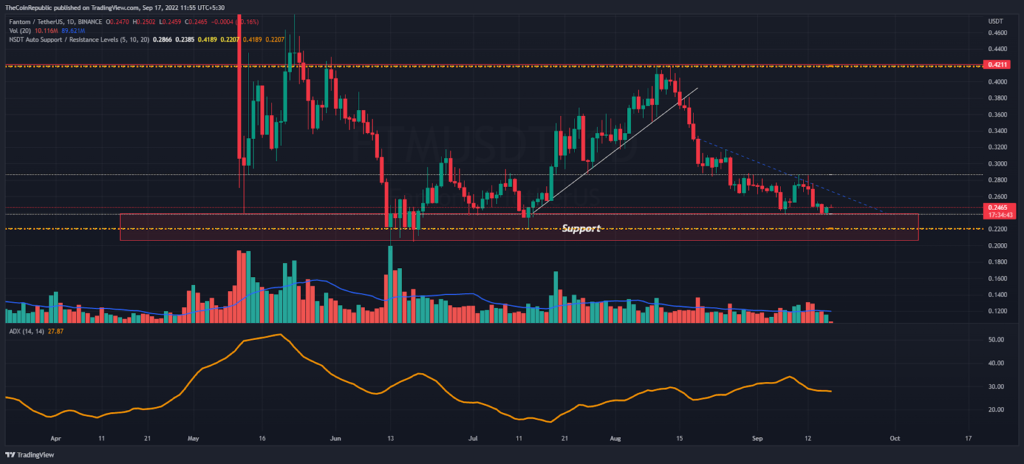
The daily price trend is trading higher below the descending trend line (dashed blue). The market cap rose 1.5% to $627 million in the last 24 hours. FTM coin is trading near a key support zone of $0.23 to $0.20.
The Average Directional Index (ADX) is showing sideways movement for Fantom Coin, well below the 20 levels on the weekly chart. Furthermore, the altcoin price may see further upside but buyers need to accumulate more as the trading volume has been decreasing for the past several days.
What’s The Next Step for FTM
Bears continue to push the asset price lower after the Bollinger Bands indicator slides below the mid-band. Thus, the coins tend to fluctuate just above the lower band of a given indicator on the daily time frame. Besides, the RSI indicator is showing a sideways zone above the oversold zone.
Conclusion
The Fantom Coin (FTM) is trading sideways near the lower band of the Bollinger Bands indicator. Bears dominate the FTM trend below the descending trend line, despite the sideways trend.
Technical Levels
Resistance level- $0.28 and $0.50
Support levels- $0.24 and $0.20
Disclaimer
The views and opinions stated by the author, or any people named in this article, are for informational ideas only and do not establish any financial, investment, or other advice. Investing in or trading crypto assets comes with a risk of financial loss.

Andrew is a blockchain developer who developed his interest in cryptocurrencies while pursuing his post-graduation major in blockchain development. He is a keen observer of details and shares his passion for writing, along with coding. His backend knowledge about blockchain helps him give a unique perspective to his writing skills, and a reliable craft at explaining the concepts such as blockchain programming, languages and token minting. He also frequently shares technical details and performance indicators of ICOs and IDOs.


