
 Home
Home News
News
- Zcash price has been consolidating inside the horizontal range-bound area over the daily chart.
- ZEC crypto has dropped below the 20, 50, 100, and 200-day Daily Moving Average.
- The pair of ZEC/BTC is at 0.00295 BTC with an intraday gain of 2.95%.
Bulls have frequently struggled to retain gains at the phase’s threshold when Zcash price has attempted to exit the consolidation phase. Positive feedback on ZEC indicates that people are now focusing on demonstrating how the token is distinct from the horizontal range. The price of the token, however, has stayed consistent between $52.00 to $70.00. While in a strong uptrend, the price of ZEC is currently rising into the upper range of the consolidation phase. ZEC bulls must hold onto their position at the trendline in order to allow the token to move above the caged region.

ZEC currently has an estimated price of $55.8, and its market capitalization increased by 1.19% yesterday. Trading volume has increased by 10.99% since then. This reveals that investors are making an effort to increase their own holdings in order to follow the ZEC coin’s recovery path. The volume to market cap ratio is 0.07888.

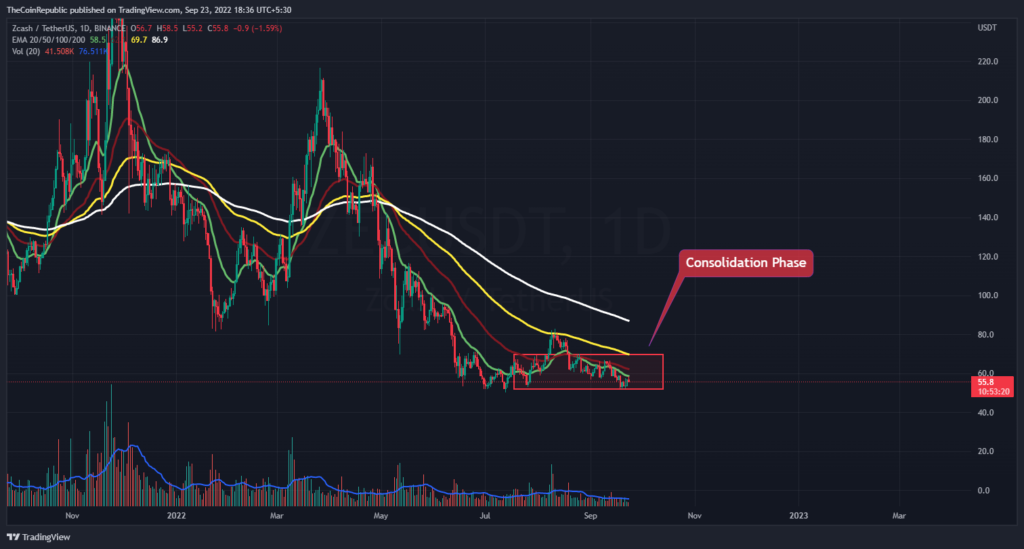
ZEC’s price is rising on the daily price chart as it gets closer to the consolidation phase’s upper trendline. Bulls must assemble at ZEC to see the breakout of the token. However, because volume indicates that the rate of accumulation is limited, bears could halt the ZEC coin’s upward momentum at any point. Bulls in ZEC must act rapidly to accumulate in order to avoid slipping into any bearish traps.
What do Technical Indicators suggest about ZEC?
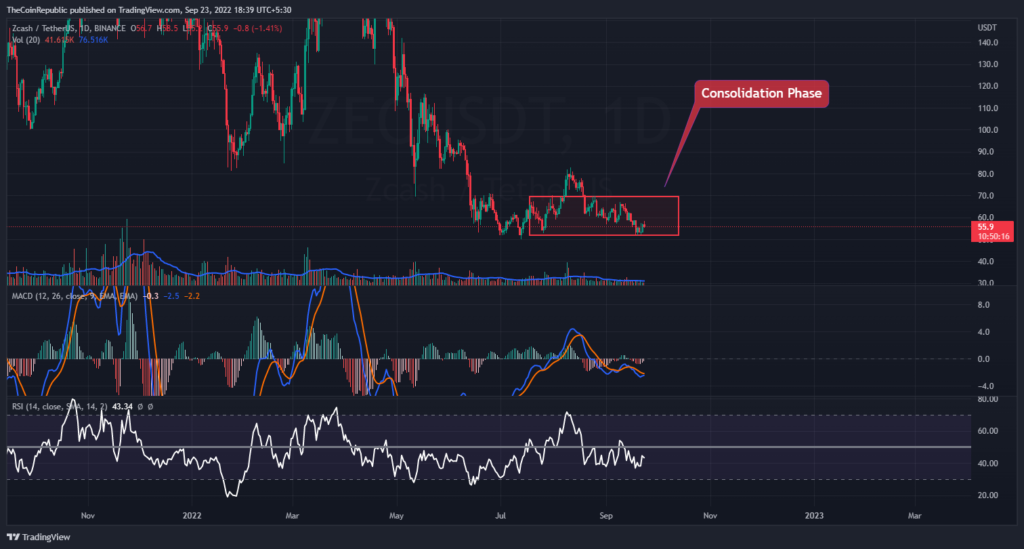
The ZEC coin price is striving to hold at the current level on the daily chart during the consolidation period. Technical signals show that the ZEC currency’s downward trajectory is quickening.
The relative strength indicator shows the sideways movement of the ZEC currency. The RSI is constant at 43, which is below neutrality. The decreasing velocity of the ZEC currency is shown by the MACD. The MACD and signal lines are about to cross in a negative way. Investors in ZEC should keep an eye on the daily chart for any changes in trends.
Conclusion
Bulls have frequently struggled to retain gains at the phase’s threshold when Zcash price has attempted to exit the consolidation phase. Positive feedback on ZEC indicates that people are now focusing on demonstrating how the token is distinct from the horizontal range. The price of the token, however, has stayed consistent between $52.00 to $70.00. While in a strong uptrend, the price of ZEC is currently rising into the upper range of the consolidation phase. Bulls in ZEC must act rapidly to accumulate in order to avoid slipping into any bearish traps.
Technical signals show that the ZEC currency’s downward trajectory is quickening. The MACD and signal lines are about to cross in a negative way. Investors in ZEC should keep an eye on the daily chart for any changes in trends.
Technical Levels
Support Levels: $53.00 and $51.00
Resistance Levels: $60.00 and $70.00
Disclaimer
The views and opinions stated by the author, or any people named in this article, are for informational ideas only, and they do not establish any financial, investment, or other advice. Investing in or trading crypto assets comes with a risk of financial loss.

Nancy J. Allen is a crypto enthusiast, with a major in macroeconomics and minor in business statistics. She believes that cryptocurrencies inspire people to be their own banks, and step aside from traditional monetary exchange systems. She is also intrigued by blockchain technology and its functioning. She frequently researches, and posts content on the top altcoins, their theoretical working principles and technical price predictions.


