
 Home
Home News
News

- The AAVE token moves sideways under a narrow horizontal box.
- Sellers inside a falling parallel channel dominate AAVE Crypto.
- Trading volume declined 26% overnight to $74.7 million.
AAVE price is showing signs of recovery even though it remains in a bullish pattern. There is no question that crypto has been under bear control for the past several months. Amidst all this volatility in prices, buyers have lost almost 88% of the cost from their all-time high of $666. Short-term bearish trend line seen in the graph following the $100 level after a price reversal.

The price action of AAVE Crypto follows in the footsteps of the bears, thus creating a high-low structure. In each time frame window, the AAVE token is looking bearish as the price moves downwards inside a descending parallel channel (bottom of chart). Buyers will have to make a lot of effort to recover from the sell-off.

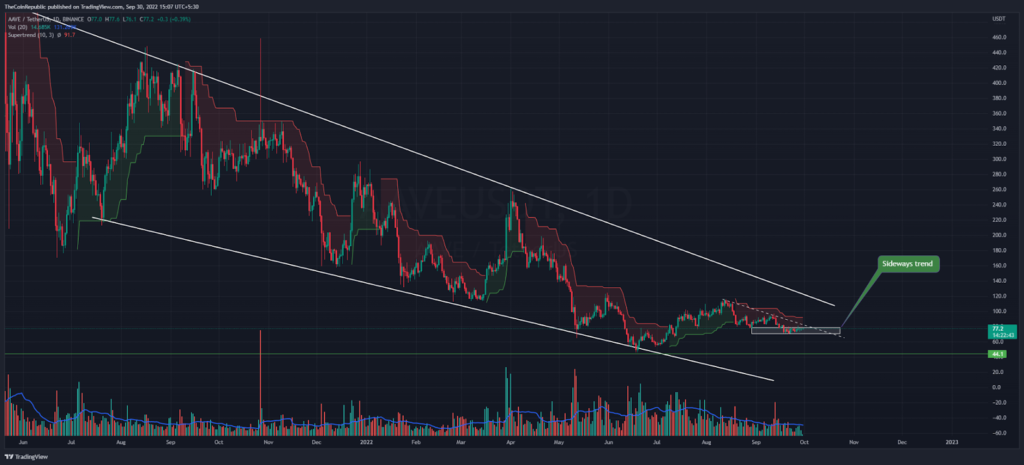
AAVE price failed to break above the conceptual rally level of $100 before moving into the consolidation phase, yet it remained a key support level. Meanwhile, as of press time, the AAVE token is trading against the USDT pair at the $77.3 mark. Furthermore, the AAVE token corresponding to the BTC match is up 1.08% at 0.003959 satoshis.
In terms of the daily price chart, buyers are struggling in the red zone of the Super Trend indicator. However, the market is limited in range, if the price breaks this range then both the bulls and the bears have a defense zone. Trading volume fell 26% overnight to $74.7 million amid Middle East momentum.
Technical Indicators
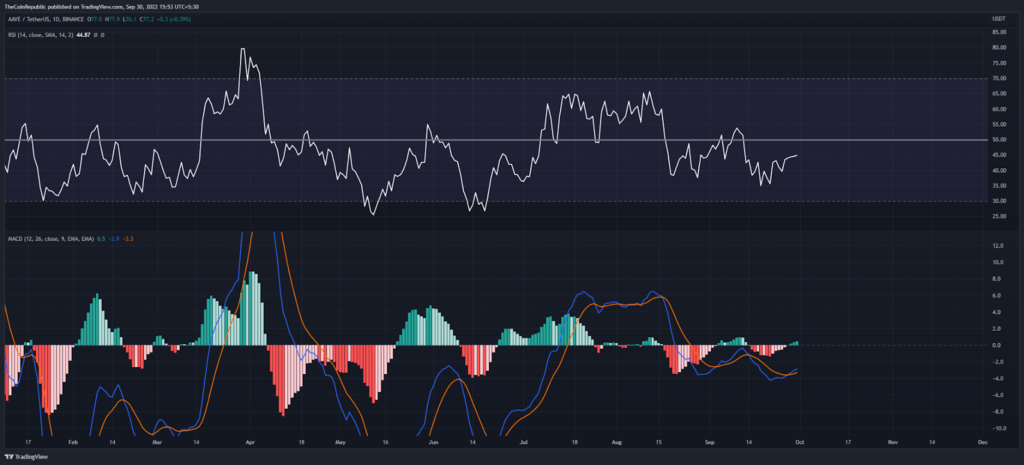
On the daily price chart, the RSI indicator does not show any trading areas until its peak is below the semi-line. Similarly, MACD is also showing no trading zone due to the consolidation phase.
Conclusion
AAVE token is trading sideways inside an exponentially bearish chart pattern. Indicators are supporting more accumulation units that break out of this narrow horizontal range. But it is certain that buyers will have to make a lot of effort to recover from the sell-off.
Support level- $70 and $40
Resistance level- $100 and $150
Disclaimer
The views and opinions stated by the author, or any people named in this article, are for informational ideas only, and they do not establish the financial investment, or other advice. Investing in or trading crypto assets comes with a risk of financial loss.
Steve Anderson is an Australian crypto enthusiast. He is a specialist in management and trading for over 5 years. Steve has worked as a crypto trader, he loves learning about decentralisation, understanding the true potential of the blockchain.


