
 Home
Home News
News

- Polygon price has been consolidating after an interesting roller coaster ride over the daily price chart.
- MATIC crypto is trading at 20, 50 and 100-days DMA and is now aiming for 200-days Daily Moving Average.
- The pair of MATIC/BTC is at 0.00004117 BTC with an intraday gain of 2.59%.
The zone in which the price of Polygon is horizontally range-bound has been successfully reentered. On July 20, the MATIC coin began to consolidate. The token returns to the horizontal range successfully. In order to indicate its breakout, the MATIC coin is currently in a phase of consolidation and is going upward into the upper range. MATIC bulls must make a breakthrough for token recovery. Investors in MATIC are required to observe any changes in course.

Currently valued at $0.817, Polygon’s market capitalization climbed by 5.98% in the previous day. Trading volume has increased by 50.03% of its market value over the last 24 hours. This shows that buyers are trying to exit the consolidation phase on the daily price chart. Volume to market cap ratio is at 0.05198.

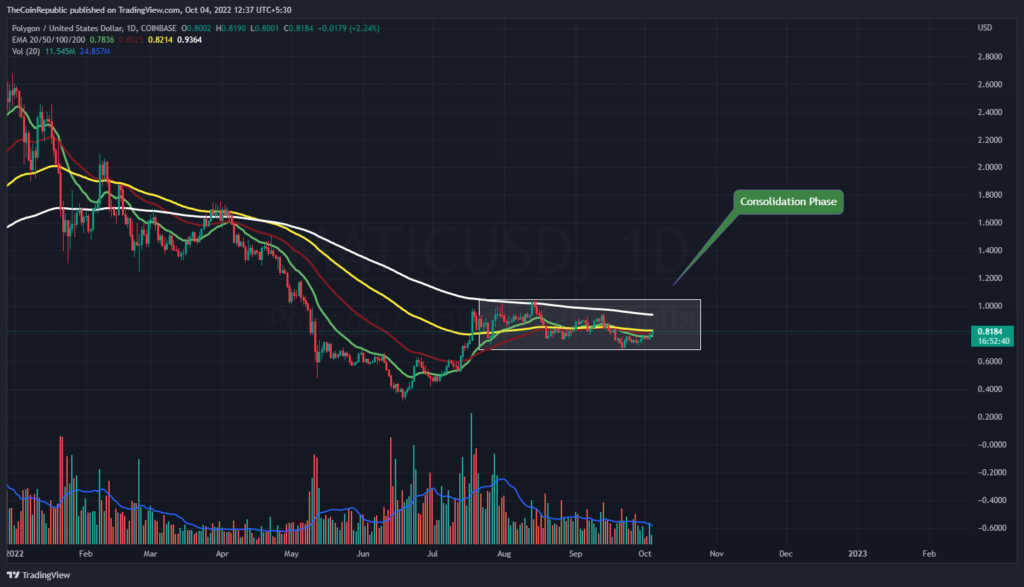
The Polygon price is currently heading toward a breakout from the consolidation period over the daily price chart. Bulls need to keep up their rate of accumulation in order for MATIC to pass through the consolidation phase. Bears, on the other hand, could try to retreat while going through the recuperation stages. Volume change is currently above average and must continue to favor bulls.
What do Technical Indicators suggest about MATIC?
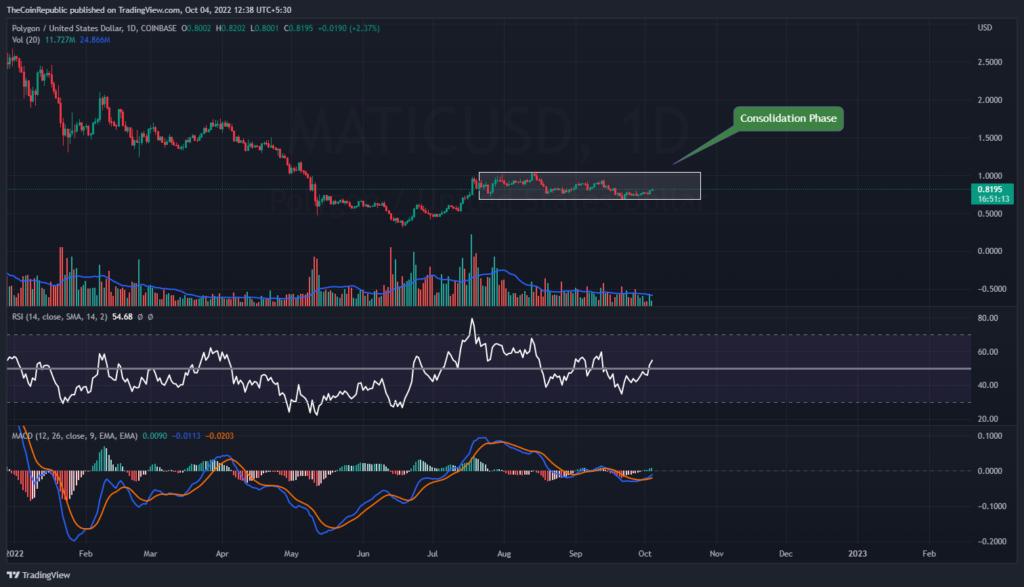
Over the daily price chart, Polygon price is aiming to keep up the pace of the current rise. The MATIC cryptocurrency must hold throughout the consolidation phase on the daily chart. For the MATIC currency, technical indicators predict impending overbought circumstances.
The relative strength indicator for the MATIC currency makes it very evident how swiftly it is rising. The RSI is getting close to overbought territory at 54. The MACD shows the increasing momentum of the MATIC coin. The MACD line is ahead of the signal line.
Conclusion
The zone in which the price of Polygon is horizontally range-bound has been successfully reentered. On July 20, the MATIC coin began to consolidate. The token returns to the horizontal range successfully. In order to indicate its breakout, the MATIC coin is currently in a phase of consolidation and is going upward into the upper range. Bears, on the other hand, could try to retreat while going through the recuperation stages. Volume change is currently above average and must continue to favor bulls. For the MATIC currency, technical indicators predict impending overbought circumstances.
Technical Levels
Support Levels: $0.75 and $0.68
Resistance Levels: $0.83 and $0.95
Disclaimer
The views and opinions stated by the author, or any people named in this article, are for informational ideas only, and they do not establish the financial, investment, or other advice. Investing in or trading crypto assets comes with a risk of financial loss.

Andrew is a blockchain developer who developed his interest in cryptocurrencies while pursuing his post-graduation major in blockchain development. He is a keen observer of details and shares his passion for writing, along with coding. His backend knowledge about blockchain helps him give a unique perspective to his writing skills, and a reliable craft at explaining the concepts such as blockchain programming, languages and token minting. He also frequently shares technical details and performance indicators of ICOs and IDOs.


