
 Home
Home News
News
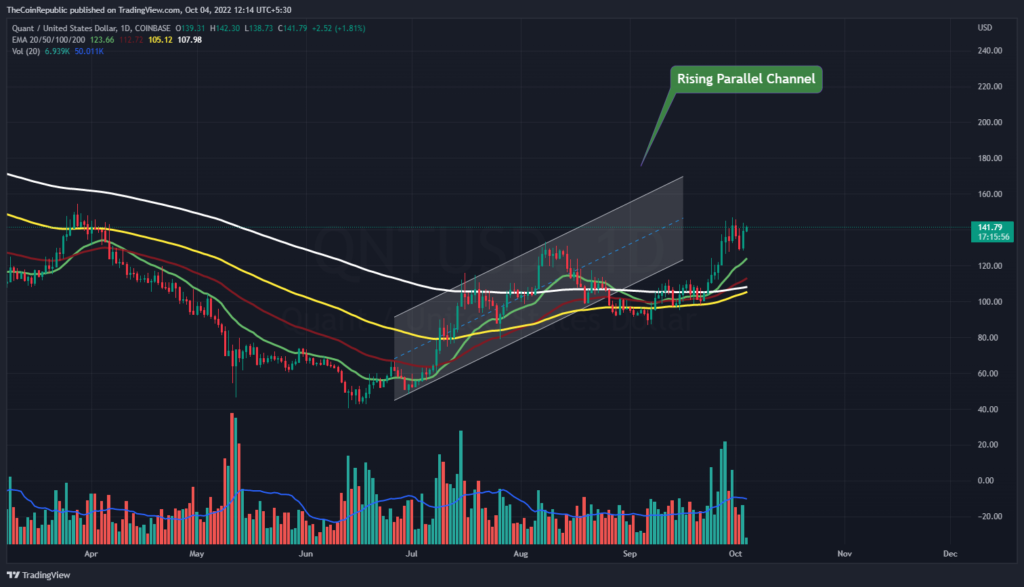
- Quant price has successfully recovered back inside the rising parallel channel over the daily price chart.
- QNT crypto is currently trading above 20, 50, 100 and 200-days Daily Moving Average showcasing the recovery phase.
- The pair of QNT/BTC is at 0.007152 BTC with an intraday gain of 3.68%.
The Quant price is climbing quickly through a similar upward channel on the daily price chart. The token first slid below a line with a downward slope, but was able to escape the pattern and enter the channel with an upward slope. Token needs to keep moving upward at this rate in order to top the daily chart. Investors in QNT must hold off until the token is widely accepted and meets with moderate resistance. The QNT currency is currently trading midway between the upper and lower trendlines of the rising parallel channel. To go closer to the top trendline, the token has to pick up the necessary upward momentum from QNT bulls.
Quant Price’s market value increased by 7.05% from the day before, when it was trading at $142.88. During intraday trading, the number of trades climbed by 12.62 percent. This exemplifies how QNT is now maintaining momentum with the help of the bulls. Volume to market cap ratio is 0.04456.
On the daily chart, the QNT coin’s price fluctuates within a rising parallel channel. QNT bulls must keep in close contact to the trendline because the coin is now flowing upstream in that direction. To reduce the volatility that bears create during the intraday trading session, the below-average QNT coin volume change must rise. After its breakthrough, the QNT coin’s price must keep rising.
What do Technical Indicators suggest about QNT?
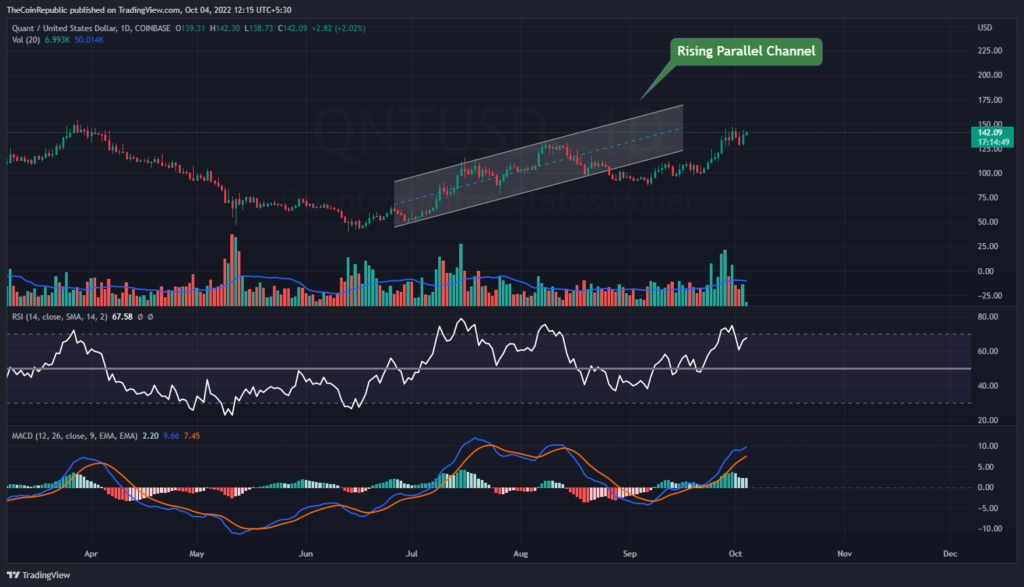
The price of the QNT coin has been fluctuating inside a rising parallel channel over the duration of the daily price chart. The token must move in the direction of the top trendline to break out of the rising pattern. The QNT coin is firmly uptrending in the direction of the ascending parallel channel, according to technical indicators.
The Relative Strength Index shows the strength of the upswing for the QNT currency. The RSI is currently trading above neutrality and getting close to overbought territory. The QNT currency is showing strong momentum on the MACD. After a positive crossover, the MACD line is ahead of the signal line. Investors in QNT should keep an eye on the daily chart for any possible patterns that might change.
Conclusion
The Quant price is climbing quickly through a similar upward channel on the daily price chart. The token first slid below a line with a downward slope, but was able to escape the pattern and enter the channel with an upward slope. Token needs to keep moving upward at this rate in order to top the daily chart. Investors in QNT must hold off until the token is widely accepted and meets with moderate resistance. To reduce the volatility that bears create during the intraday trading session, the below-average QNT coin volume change must rise. After its breakthrough, the QNT coin’s price must keep rising. The QNT coin is firmly uptrending in the direction of the ascending parallel channel, according to technical indicators.
Technical Levels
Support Levels: $130.00 and $120.00
Resistance Levels: $145.00 and $155.00
Disclaimer
The views and opinions stated by the author, or any people named in this article, are for informational ideas only, and they do not establish the financial, investment, or other advice. Investing in or trading crypto assets comes with a risk of financial loss.

With a background in journalism, Ritika Sharma has worked with many reputed media firms focusing on general news such as politics and crime. She joined The Coin Republic as a reporter for crypto, and found a great passion for cryptocurrency, Web3, NFTs and other digital assets. She spends a lot of time researching and delving deeper into these concepts around the clock, and is a strong advocate for women in STEM.


