
 Home
Home News
News

- Uniswap price has been consolidating below the rising parallel channel over the daily price chart.
- UNI crypto is trading at 20, 50 and 100-days DMA but still below 200-days Daily Moving Average.
- The pair of UNI/BTC is at 0.0003358 BTC with an intraday gain of 0.61%.
The Uniswap price has fallen below the ascending parallel channel over the last day and has lost around 13% of its market value. The UNI currency must be supported by the purchasers in order for it to rise once more inside the parallel channel. However, bears continue to make attempts to push the UNI currency below the ascending channel. Bulls must stock up and hold onto their position when the UNI currency approaches the $6.65 resistance level. Determining whether UNI bulls are effective in providing the symbolic support necessary to avert rejection from the current level will take some time.

Market capitalization for Uniswap has climbed by 4.04% during the last 24 hours to an estimated $6.63. However, trading volume jumped by 22.99% during the intraday trading session. This demonstrates that the UNI coin is being actively pushed by UNI bulls. Volume to market cap ratio is 0.03558.

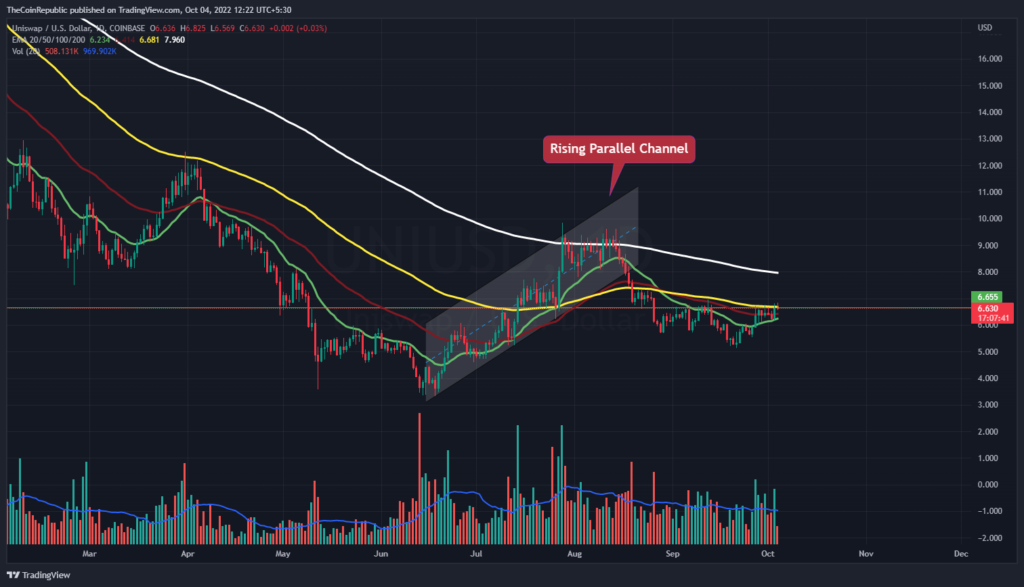
The price of the UNI coin is falling quickly over the daily price chart. On the daily chart, the cryptocurrency asset is currently declining after being rejected from an ascending parallel channel. Before UNI bulls can allow the token to cross the daily chart, they must first develop independently. However, red huge volume bars show bears’ involvement and the decline of the UNI coin.
What do Technical Indicators suggest about UNI?
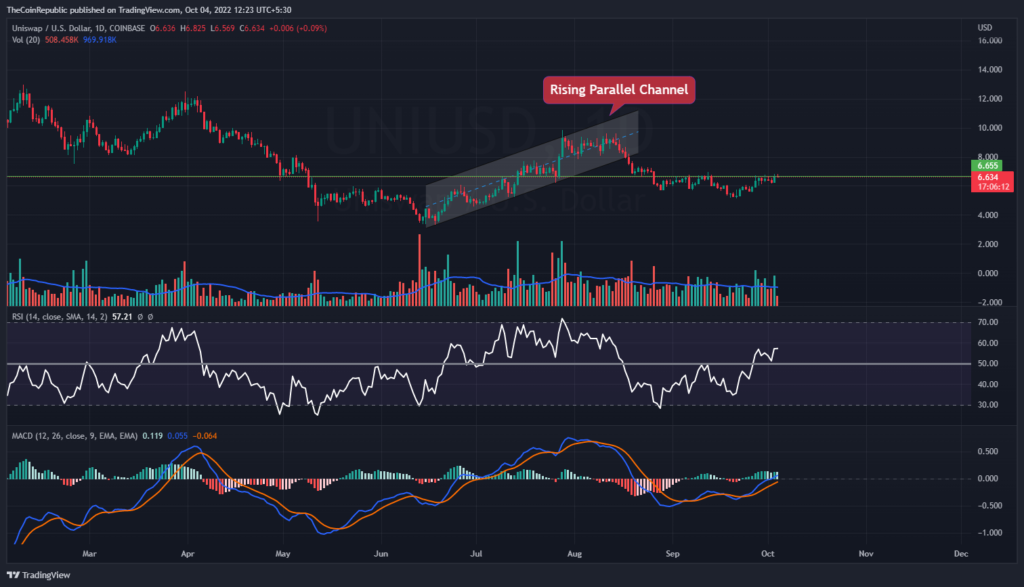
The price of the UNI coin must entice buyers in order for the token to outperform the daily price chart. The token must rebound inside the upward parallel channel on the daily price chart. Technical indications show an upward tendency for the UNI coin.
The relative strength index shows how quickly the UNI currency is moving up. At 57, the RSI is slightly above neutrality. The MACD chart shows the positive momentum of the UNI coin. The signal line is in front of the MACD line. Investors in UNI must keep an eye on the daily chart for any changes in trend.
Conclusion
The Uniswap price has fallen below the ascending parallel channel over the last day and has lost around 13% of its market value. The UNI currency must be supported by the purchasers in order for it to rise once more inside the parallel channel. However, bears continue to make attempts to push the UNI currency below the ascending channel. Bulls must stock up and hold onto their position when the UNI currency approaches the $6.65 resistance level. Before UNI bulls can allow the token to cross the daily chart, they must first develop independently. However, red huge volume bars show bears’ involvement and the decline of the UNI coin. Technical indications show an upward tendency for the UNI coin.
Technical Levels
Support Levels: $6.15 and $5.50
Resistance Levels: $6.65 and $7.30
Disclaimer
The views and opinions stated by the author, or any people named in this article, are for informational ideas only, and they do not establish the financial, investment, or other advice. Investing in or trading crypto assets comes with a risk of financial loss.
Steve Anderson is an Australian crypto enthusiast. He is a specialist in management and trading for over 5 years. Steve has worked as a crypto trader, he loves learning about decentralisation, understanding the true potential of the blockchain.


