- Solana crypto is down 2% during the sideways movement over the past 24 hours.
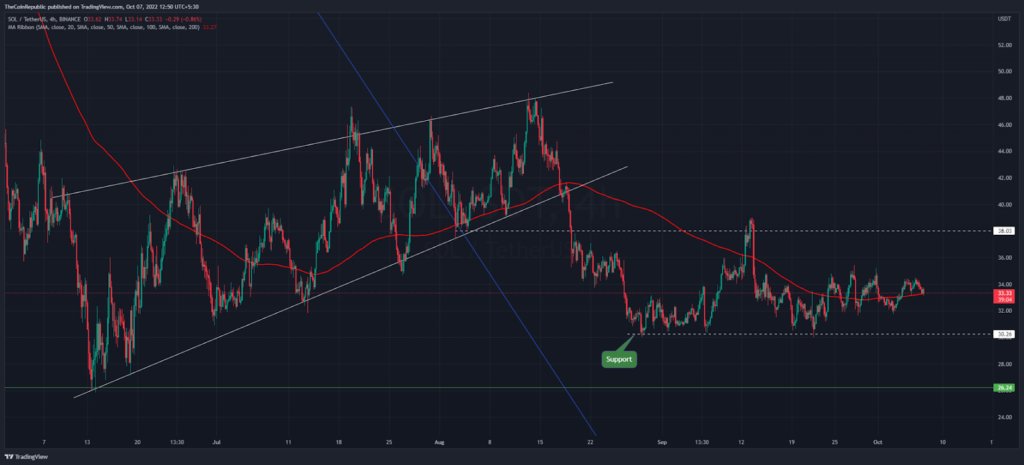
- Solana price is taking support at the 200 DMA on the 4-hours price chart.
- Trading volume decreased by 8.5% to $652.3 million in the last 24 hours.
Solana crypto against the USDT pair is trading at the $33.3 mark as of press time. SOL values have already spent more than 45 days below the $40 mark. This round level is acting as a major bullish barrier for the swing traders. Bulls are facing higher price rejection after booking their short term gains near this level.
Mid-June to mid-August was a good time for investors, with prices moving higher within a rising wedge pattern in terms of the daily price scale. Later, Solana crypto went sideways above the key support level of $30, which gave the price pump at times. Conversely, the $38-$40 area is acting as a short-term bullish barrier.
In the context of a 4 hours price chart, buyers barely manage to keep the price of Solana crypto above the 200 day moving average (red). Although, the price has been trading in a sideways trend for several days. This price accumulation may turn strong directional trend whether upside or downside.
Buyers Try to Sustain Solana Crypto Above 200-DMA on 4-Hour Chart
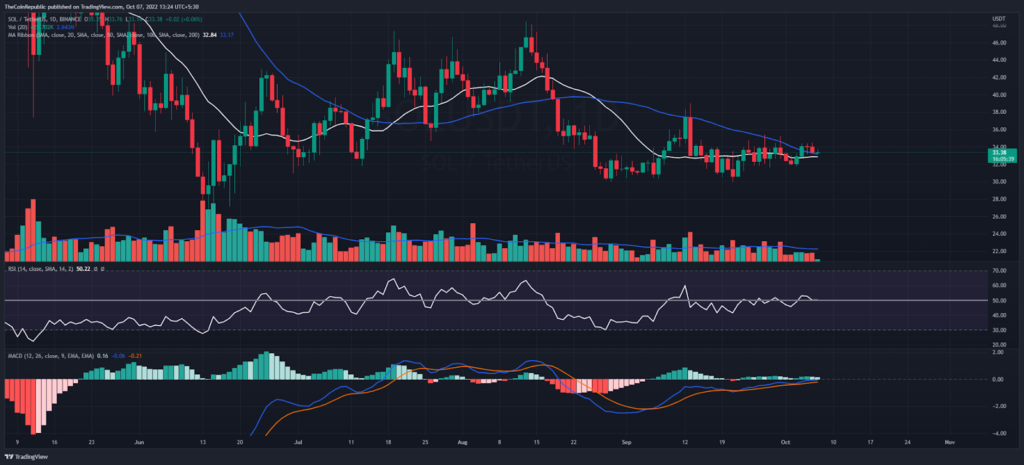
In terms of the daily price chart, altcoin price observes above 20 and 50 DMAs today. Solana crypto follows the footsteps of bitcoin, thus, the LTC/BTC pair price is down 0.5% at 0.001673 satoshis. Due to low liquidation, Trading volume decreased by 8.5% in the last 24 hours at $652.3 Million.
The daily RSI indicator seems to be flat at semi-line and the MACD indicator moves gradually higher into the negative region.
Conclusion
Solana crypto is looking sideways just above the 50 Day moving average. Buyers try to defend themselves from upcoming drops. Traditional indicators like RSI and MACD show a sideways trend for Solana price.
Resistance level- $38 and $50
Support level- $30 and $26
Disclaimer
The views and opinions stated by the author, or any people named in this article, are for informational ideas only, and they do not establish the financial, investment, or other advice. Investing in or trading crypto assets comes with a risk of financial loss.

Nancy J. Allen is a crypto enthusiast, with a major in macroeconomics and minor in business statistics. She believes that cryptocurrencies inspire people to be their own banks, and step aside from traditional monetary exchange systems. She is also intrigued by blockchain technology and its functioning. She frequently researches, and posts content on the top altcoins, their theoretical working principles and technical price predictions.


 Home
Home News
News


