
 Home
Home News
News

- Twitter stock price is performing well during retesting the $52 resistance zone.
- On daily as well as weekly time frame, TWTR price stays above EMA Ribbon indicator.
- The Pre Market opening hints price at $50.15 level, up 0.42% on Thursday 13 October.
Recently Elon Musk revived his bid to buy Twitter. On 4 October, Elon Musk again proposed an offer to buy a Twitte on the original price of $54.20 per shere. Behind the announced, Twitter price jumped over 12.18% last weed and recorded highest bullish weeek since late-March. Excitement can clearly seen among investors after Musk’s announcement but let see if this enthusiasm will stable ahead or not.

In last few weeks, speculators noted high volatility in Twitter stock price where annual low at $31.30 was reported in Feb. in contrast, price action shows bullish mode nowadays. The 2022 year seems to be good for investors so far, compared to the 2021. Buyers are happy after price recovery in october.

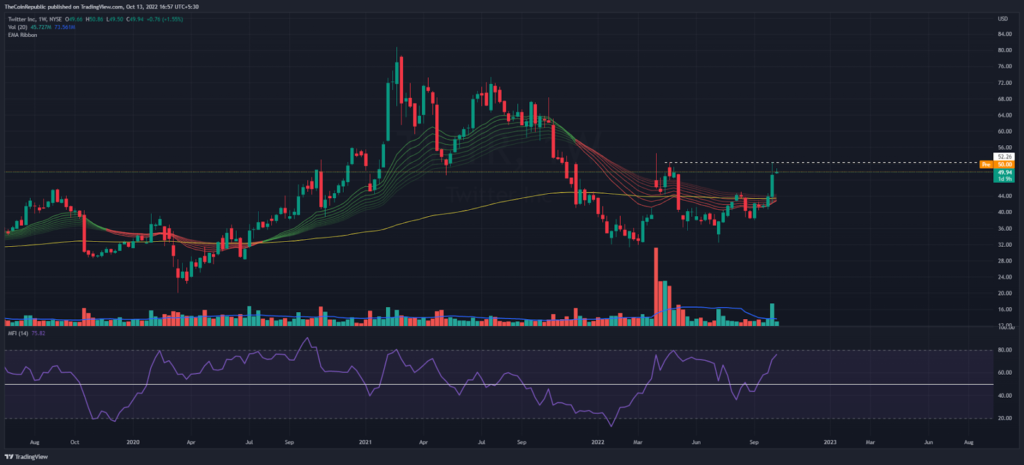
Pre market opening session hints price at $50.15 level, up 0.42% on Thursday 13 October. Last night price reported at $49.94 level, was down 0.26%. Although weekly price action of Twitter shows higher-lows pattern while price approaches $52 level as an immediate bullish hurdle.
Buyers are aggrasively accumulating Twitter price because of the price sustainability above EMA Ribbon indicator either in daily time frame or weekly. In addition, Weekly RSI is going press the doorbell of extreme overbought zone, which is favorable sign for buyers and investors.
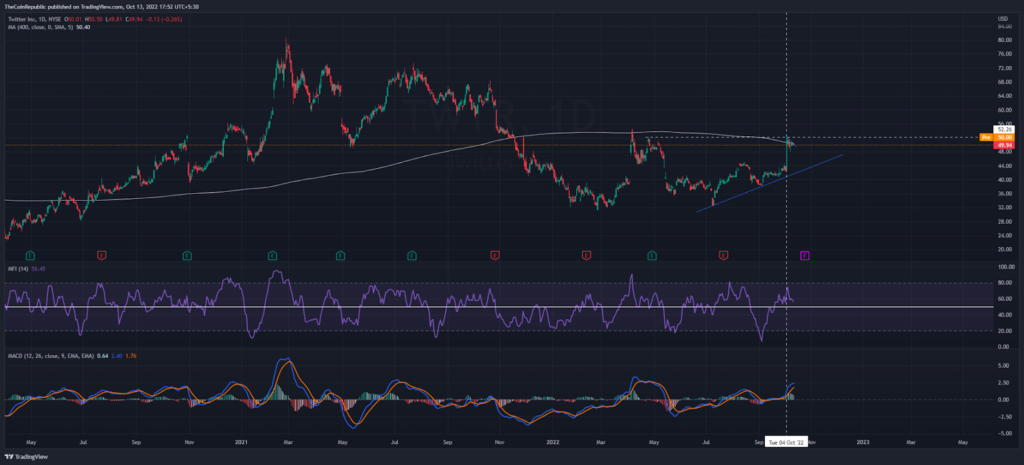
On 4 October during Elon Musk announcement, the Twitter stock price hiked over 22% in a day. However, later on, it went into the sideways territory below the $50 resistance. Now buyers struggle at 400 day simple moving average for more profites.
On daily price chart, RSI reverse towards the semi-line. In contrast, MACD continues expecding higher into the positive regoin.
Conclusion
The Twitter Stock Price remains below the $52 resistance level. In the weekly time frame, RSI indicator suggests the intense support to bulls as its peak goes under higher territory. Besides, on daily price RSI shows slightly weak momentum in Stock price.
Resistance level- $52 and $70
Support level- $40and $30
Disclaimer
The views and opinions stated by the author, or any people named in this article, are for informational ideas only, and they do not establish the financial, investment, or other advice. Investing in or trading crypto assets comes with a risk of financial loss.

Andrew is a blockchain developer who developed his interest in cryptocurrencies while pursuing his post-graduation major in blockchain development. He is a keen observer of details and shares his passion for writing, along with coding. His backend knowledge about blockchain helps him give a unique perspective to his writing skills, and a reliable craft at explaining the concepts such as blockchain programming, languages and token minting. He also frequently shares technical details and performance indicators of ICOs and IDOs.


