
 Home
Home News
News
- BP stock price appears to be highly volatile near the $30 round level.
- On Thursday, October 20, BP stock price successfully closed the daily candle above the 200-day moving average.
- Amid tight range, BP investors have gained around 2.08% so far this week.
BP recently announced its biggest acquisition in low-carbon fuels, with plans to buy a US-listed biogas producer for $4.1 billion, as the UK’s leading oil company continues its push from fossil fuel assets. wants to accelerate. BP chief executive Bernard Looney said the deal was the best deal for large shareholders.

The deal caused the BP stock price to rise sharply but the market wanted a more positive factor for the insane reaction. Gradually, the NYSE;BP stock price is narrowing its trading range and for the past three weeks, weekly price candles still appear inside the candles. As of now, BP stock price has remained in higher zones.

As it nears an all-time high of $34.3, buyers BP stock price is drawing a lower-high formation, which gives way to market sellers. Meanwhile, there is a key selling point called the bearish trend line, which influenced the bullish trend of the past 19 weeks. Nevertheless, the price crosses this range. Again buyers may see a drop in price at this point.
From a longer-term perspective, the BP stock price structure is forming a high-low and a low-high on the daily time frame and above. On Thursday, October 20, BP stock price successfully closed the daily candle above the 200-day moving average. This key volatility area has flipped into an upcoming support level.
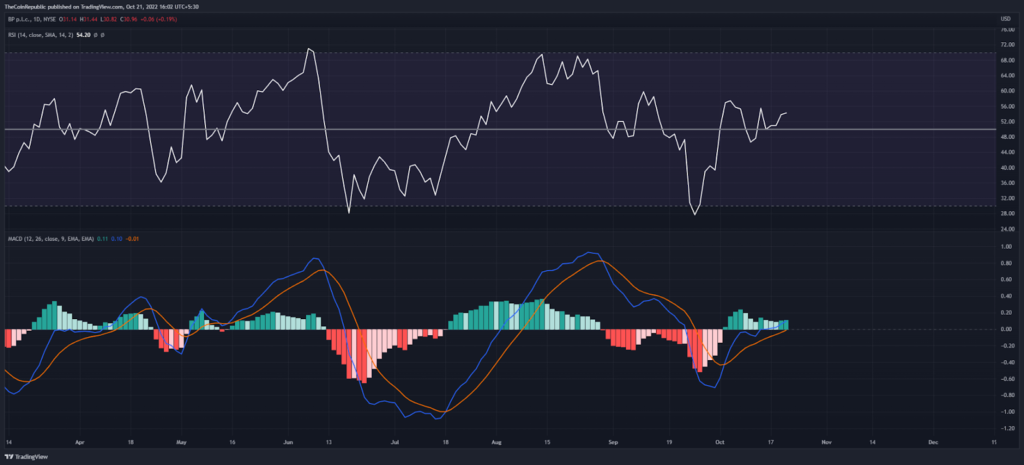
On Thursday October 20th, BP stock price fell 0.19% and closed at the $30.96 mark. The $30 round is a red zone for volatility and buyers should wait for the weekly close. Meanwhile, the RSI indicator is targeting the overbought zone and the MACD is about to suggest a strong positive trend.
Conclusion
BP stock price remains below a falling trend line amid candlestick pattern. The 200 day moving average is set to provide a price pump in the upcoming trading session. Also, the RSI and MACD favor the buyers.
Technical Levels
Support level – $30 and $25
Resistance level – $31.5 and $34.2
Disclaimer
The views and opinions stated by the author, or any people named in this article, are for informational ideas only, and they do not establish financial, investment, or other advice. Investing in or trading crypto assets comes with a risk of financial loss.
Steve Anderson is an Australian crypto enthusiast. He is a specialist in management and trading for over 5 years. Steve has worked as a crypto trader, he loves learning about decentralisation, understanding the true potential of the blockchain.


