
 Home
Home News
News
- NASDAQ: Adobe’s share price was down 0.57% on Thursday at $318.65.
- In the context of the daily price chart, buyers struggle with the 50 day exponential moving average.
- The RSI indicator looks a bit weak moving towards the half-line.
Adobe’s NASDAQ capitalization has shifted as the company grows slowly. Adobe stock went up 4% late on October 18 after the software provider released fiscal year 2020 guidance that fell below expectations, but attributed some of the drop to a stronger dollar and unfavorable foreign exchange rates.
Adobe’s stock price remained bullish from October 18 until Wednesday. Buyers were busy booking their profits in the letter dated Thursday, October 18, causing the stock price to fall last night. Following a strong uptrend, buyers had a bad day on Thursday due to a sell-off, and bears are targeting further downside this week.
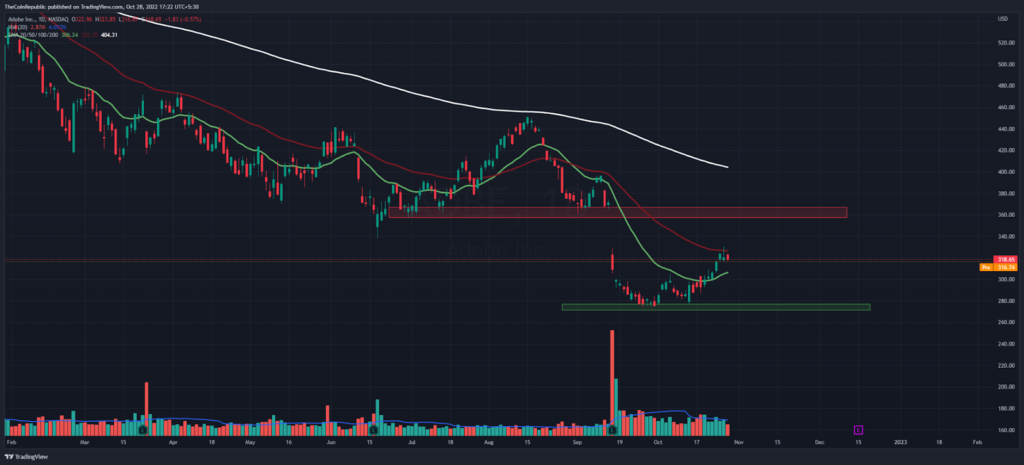
Adobe stock price trades in a narrow range for the last three trading sessions. For downtrends this is due to the exponential moving average of the day sideways. The 50 EMA (red) interrupted the bullish trend, so the price was down last night.
On the daily price chart, the 20 EMA has turned support. On the other hand, the 50 EMA is yet to be broken as an immediate bullish barrier. As per the price chart, Adobe stock price is trading between a supply and a demand zone. However, trading volume stood at $5.75 million on Thursday. Trading volumes were lower as compared to other trading sessions, hence the downside could be further positive.
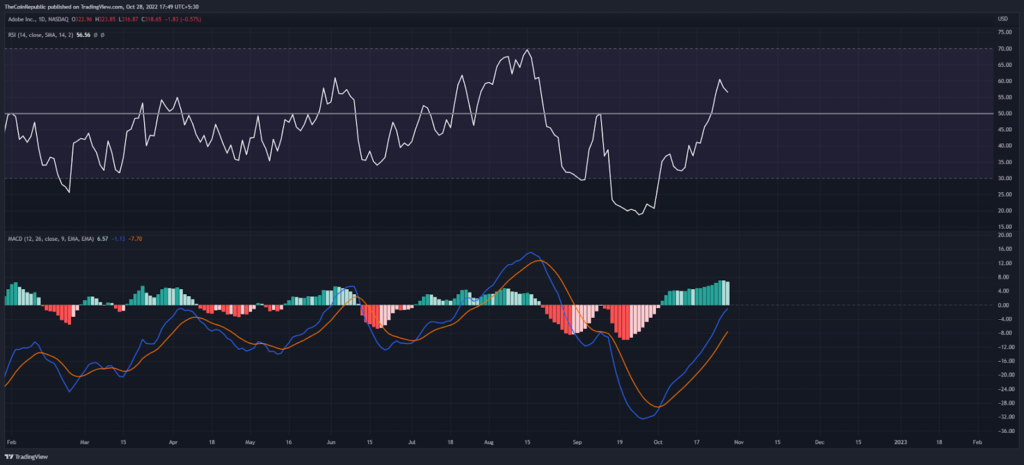
On the daily price chart, the RSI indicator looks slightly weak as it moves towards a semi-line, showing slight downside in the digital asset. Conversely, the MACD indicator looks bullish for a bullish trend as both the moving lines are about to leave the negative zone.
Conclusion
Undoubtedly the Adobe stock price is correcting itself after the fall, but buyers are tired of the close of the 50-day exponential moving average on the daily price chart. With only one trading session left in this week, the upcoming weekly opening could decide the direction.
Support level – $275 and $250
Resistance level – $330 and $365
Disclaimer
The views and opinions stated by the author, or any people named in this article, are for informational ideas only, and they do not establish financial, investment, or other advice. Investing in or trading crypto assets comes with a risk of financial loss.
Steve Anderson is an Australian crypto enthusiast. He is a specialist in management and trading for over 5 years. Steve has worked as a crypto trader, he loves learning about decentralisation, understanding the true potential of the blockchain.


