
 Home
Home News
News

- Ethereum price found a higher price rejection near the $1600 resistance area.
- The price of the asset is staying above the red moving line of the EMA ribbon indicator on the daily chart.
- Ethereum price is trading slightly lower by 0.77% at 0.07437 satoshis related to the bitcoin pair.
The Ethereum and Bitcoin cryptocurrencies turned positive this week, helping the entire market recover costs. The market is struggling since last night due to the recent selloff that started last night. Thus, investors are expecting a trend reversal as they have just created the first long position and may suffer losses if the market turns lower further.

Market Influencer – Bitcoin fluctuates below the $21K level despite the bullish momentum, therefore, little uncertainty creates the market place. Ethereum price immediately corrected from lower levels, while the $1200 level is acting as a key hedge area for the bulls. Meanwhile, as of press time, Ethereum price is trading at the $1,503 mark against the USDT pair. Digital money is still in the red at 0.75% in the intraday trading session.

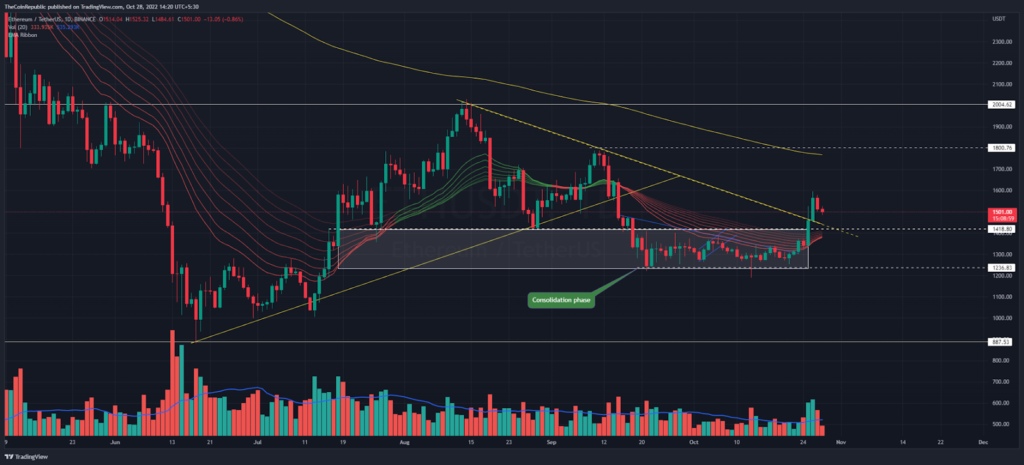
The Ethereum price continues making the second bullish candle this week, thus the price is up 10% so far. Eventually buyers overcame selling pressure as they breached the long-term bearish trendline. Despite the price correction, buyers are expecting a more positive trend above the $1500 support level. Bears aim to break through this level.
Weekly high $1600 turned into an immediate bullish hurdle. However, trading volume seems to be low at $22.09 Billion as per overnight data. Nevertheless, Asset price stays above the red moving lines of the EMA Ribbon indicator over the daily chart. Moreover, Ethereum price concerning the Bitcoin pair is slightly down 0.77% at 0.07437 satoshis.
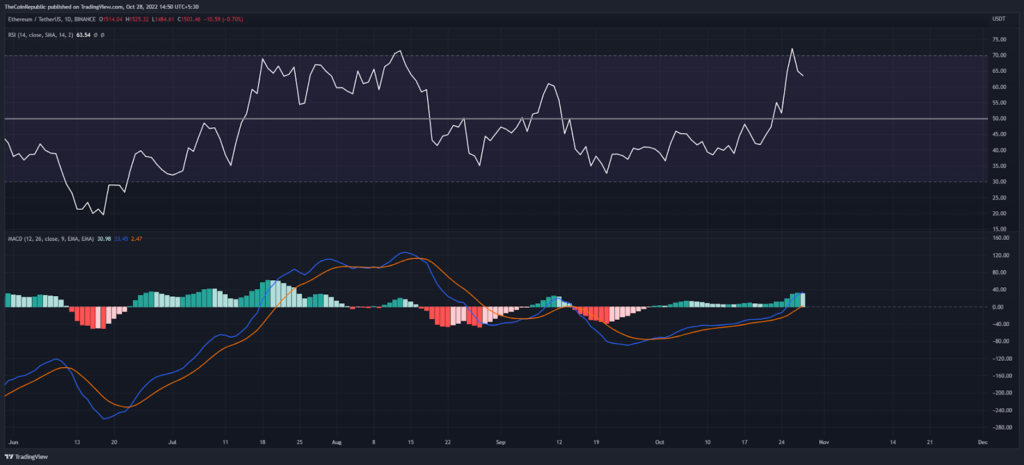
On the daily price chart, the RSI indicator reversed from the overbought zone. At the time, its peak was spotted at 63 level, still positive as long as it stays above halfway. MACD indicator is going through above neutral zone along with higher-highs histograms.
Conclusion
The Ethereum price trades just above the $1500 level. Any price dip may bring opportunity for bears. Bulls need to maintain asset prices higher above the red moving lines of the EMA ribbon indicator.
Support level – $1400 and $1200
Resistance level – $1600 and $2000
Disclaimer
The views and opinions stated by the author, or any people named in this article, are for informational ideas only, and they do not establish financial, investment, or other advice. Investing in or trading crypto assets comes with a risk of financial loss
Steve Anderson is an Australian crypto enthusiast. He is a specialist in management and trading for over 5 years. Steve has worked as a crypto trader, he loves learning about decentralisation, understanding the true potential of the blockchain.


