
 Home
Home News
News

- Dash price is trying to reverse the trend inside the consolidation phase at 2020 lows.
- DASH Crypto is currently trading below 20, 50, 100 and 200-days Daily Moving Average.
- The pair of DASH/BTC is at 0.00225 BTC with an intraday gain of 5.93%.
On the daily price chart, the price of Dash is attempting to hold at the beginning of the consolidation period. To remain where it is, the coin must maintain its present rate of growth. DASH bulls are making every effort to prevent DASH from dropping below the consolidation phase on the daily chart. Since June 25, Dash coin has been stuck in a horizontal range-bound region; this region has now been effectively broken. The cost of one Dash coin has remained constant at $39.50 to $53.80. In the meanwhile, DASH bulls must consolidate in order to witness the token’s breakthrough from the consolidation phase.

Dash’s estimated price is $46.55 and its market cap has dropped by 5.62% during the last 24 hours. 7.31% fewer deals were made during intraday trading. This indicates that traders may be trying to take advantage of the opportunity to aid DASH in exiting the consolidation phase, but it appears that they are still actively engaged in the trade. Volume to market cap ratio is 0.2353.

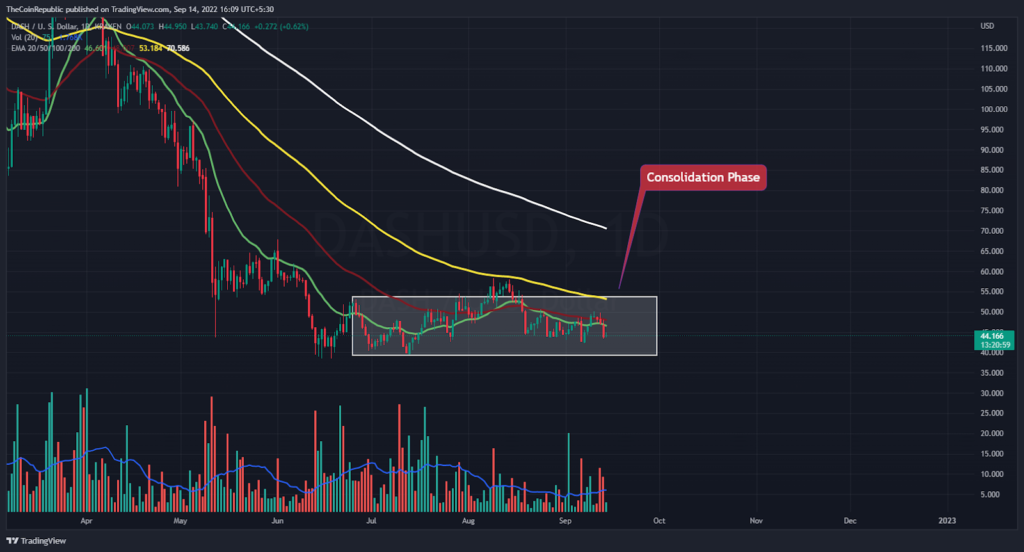
The daily price chart for DASH shows that the price is rising as it approaches the top trendline of the consolidation period. The token can only emerge if there are enough bulls in DASH. Bears, however, could suddenly stop the DASH currency’s upward momentum given that volume shows that the rate of accumulation is limited. Bulls in DASH must quickly build up to avoid falling into any bearish traps.
Will DASH Surge Back Towards the Upper Range?
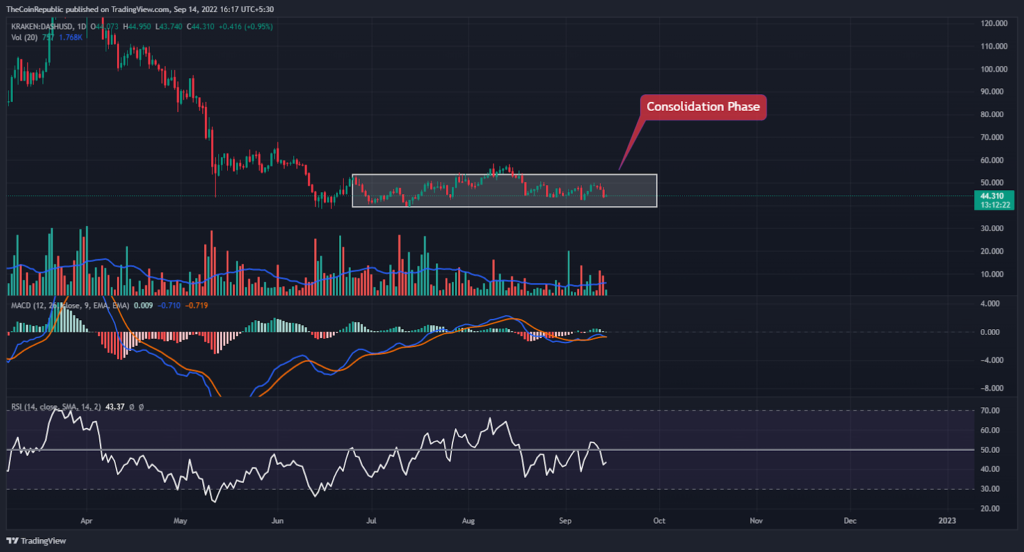
On the daily chart, the value of the cryptocurrency DASH has been rising. The DASH coin appears to be going upward, according to technical indicators. The relative strength index (RSI) demonstrates the DASH coin’s rising momentum. The RSI is practically neutral at 43 points. The DASH cryptocurrency’s increasing trend can be seen on MACD. In advance of either crossover, the MACD line is crossing the signal line. Investors in DASH must monitor the chart for any shifts in trend.
Conclusion
On the daily price chart, the price of Dash is attempting to hold at the beginning of the consolidation period. To remain where it is, the coin must maintain its present rate of growth. DASH bulls are making every effort to prevent DASH from dropping below the consolidation phase on the daily chart. Since June 25, Dash coin has been stuck in a horizontal range-bound region; this region has now been effectively broken. The cost of one Dash coin has remained constant at $39.50 to $53.80. Bears, however, could suddenly stop the DASH currency’s upward momentum given that volume shows that the rate of accumulation is limited. Technical indicators suggest that the DASH coin is now moving upwards. The MACD line is overlapping the signal line in anticipation of either of the crossover. DASH investors need to keep an eye on the chart for any changes in trend.
Technical Levels
Support Levels: $42.00 and $40.00
Resistance Levels: $50.00 and $55.00
Disclaimer
The views and opinions stated by the author, or any people named in this article, are for informational ideas only, and they do not establish the financial, investment, or other advice. Investing in or trading crypto assets comes with a risk of financial loss.

Andrew is a blockchain developer who developed his interest in cryptocurrencies while pursuing his post-graduation major in blockchain development. He is a keen observer of details and shares his passion for writing, along with coding. His backend knowledge about blockchain helps him give a unique perspective to his writing skills, and a reliable craft at explaining the concepts such as blockchain programming, languages and token minting. He also frequently shares technical details and performance indicators of ICOs and IDOs.


