
 Home
Home News
News

- OKB pierce prediction suggests the recovery phase of OKB crypto over the daily chart following an interesting pattern.
- OKB crypto has recovered above 20, 50, 100 and 200-days Daily Moving Average.
- The pair of OKB/BTC is at 0.001121 BTC with an intraday gain of 6.13%.
OKB price has been consolidating below a resistance level but it looks like the token is finally prepared to sustain above the resistance level of $23.00. Meanwhile, OKB buyers have proved themselves as the token has shown great recovery inside the ascending triangle pattern over the daily price chart. OKB crypto is trying to sustain at the verge of the pattern and waiting for its recovery by sustaining. OKB investors need to wait for any directional change as the token is currently struggling to sustain at the verge of the ascending triangle pattern.

The market capitalization of OKB has risen by 2.79% over the past day and is currently worth $23.228. However, the trade volume dropped by 8.00% during the intraday trading session. This exemplifies the token being moved from the upper level by bears.

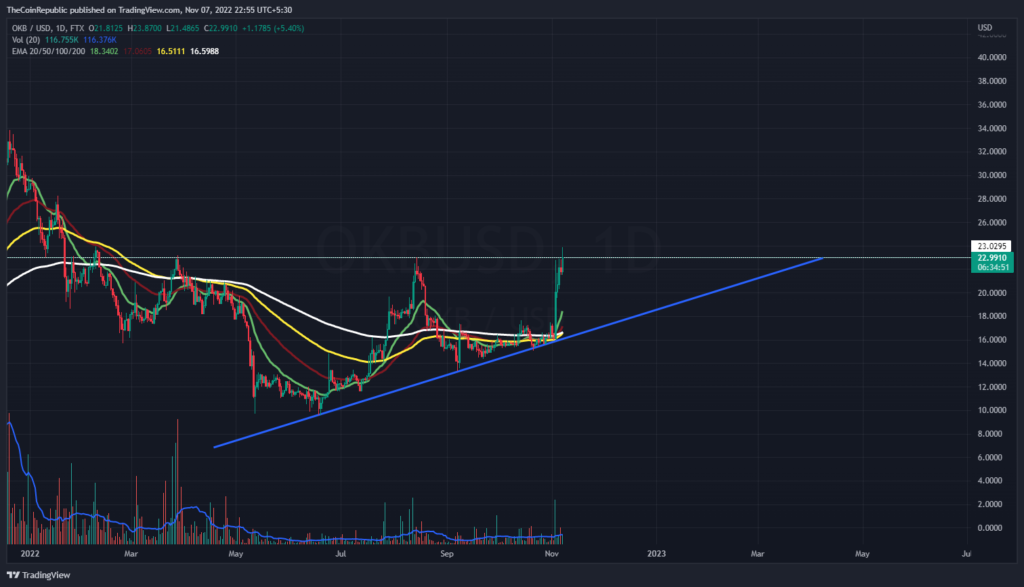
OKB crypto must surge away from the ascending triangle pattern and recover significantly over the daily price chart. OKB price action shows that OKB cryptocurrency is currently trying to sustain at the current level. Meanwhile, volume change is trying to surpass average and needs to grow for OKB to surge over the daily chart. Meanwhile, OKB crypto has recovered above 20, 50, 100 and 200-days Daily Moving Average.
What do Technical Indicators suggest about OKB?
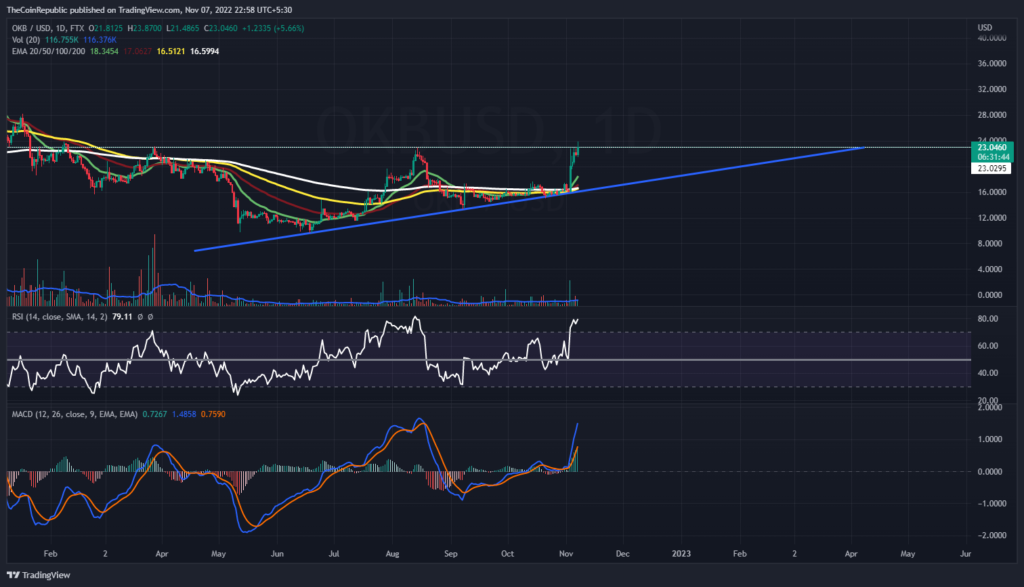
Technical indicators suggest the recovery phase of OKB crypto. Relative Strength Index showcases the uptrend momentum of OKB coin. RSI is at 79 and is heading towards the extreme overbought territory. MACD exhibits the uptrend momentum of OKB crypto. The MACD line is far ahead of the signal line. OKB investors must wait for the maximum recovery of OKB crypto.
Conclusion
OKB price has been consolidating below a resistance level but it looks like the token is finally prepared to sustain above the resistance level of $23.00. Meanwhile, OKB buyers have proved themselves as the token has shown great recovery inside the ascending triangle pattern over the daily price chart. Meanwhile, volume change is trying to surpass average and needs to grow for OKB to surge over the daily chart. The MACD line is far ahead of the signal line. OKB investors must wait for the maximum recovery of OKB crypto.
Technical Levels
Support Levels: $21.00 and $20.00
Resistance Levels: $23.00 and $25.00
Disclaimer
The views and opinions stated by the author, or any people named in this article, are for informational ideas only, and they do not establish the financial, investment, or other advice. Investing in or trading crypto assets comes with a risk of financial loss.
Steve Anderson is an Australian crypto enthusiast. He is a specialist in management and trading for over 5 years. Steve has worked as a crypto trader, he loves learning about decentralisation, understanding the true potential of the blockchain.


