
 Home
Home News
News
- ApeCoin price must avoid falling from the consolidation phase over the daily price chart.
- APE crypto has slipped below 20, 50, 100 and 200-days Daily Moving Average.
- The pair of APE/BTC is at 0.0001769 BTC with an intraday gain of 0.11%.
The daily Apecoin price chart contains several fascinating clues that the price is now declining. The APE cryptocurrency is currently trading at a lower price and is approaching close to its record low, making it challenging for it to gain support. APE Crypto wants to reverse the upward trend, but in order to do so, it will need to draw in more buyers in order to counteract the sellers and keep short-sellers away. The price of APE coins needs to increase in order to move back to the higher range. Investors in APEs should monitor the daily chart for any changes in trend.
The estimated value of ApeCoin is $2.91 as of right now, which is a decrease of 2.06% from its market capitalization the day prior. The trade volume for the intraday trading session has decreased by 37.32% in the interim. This demonstrates the desire of sellers to lower the price of the APE coin.
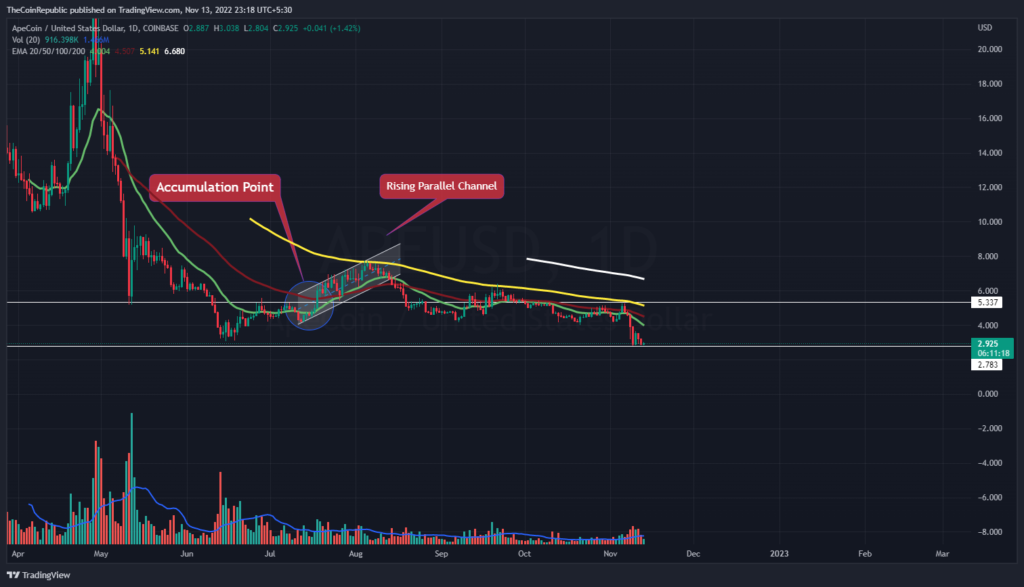
On the daily price chart, the APE coin’s price is dropping swiftly. To go through the parallel channel, the token needs more buyers. For APE currency to cross the channel once more, volume change must rise; it is presently below average. Before analyzing the price movement of the APE coin, investors must wait for any directional change.
What do Technical Indicators suggest about APE?
More buyers are required for the price of APE coin to once again soar toward the parallel channel. APE bulls must gather their strength while they wait for the token to throttle hard and shoot back into the pattern. Technical indicators show how quickly the APE currency is losing value.
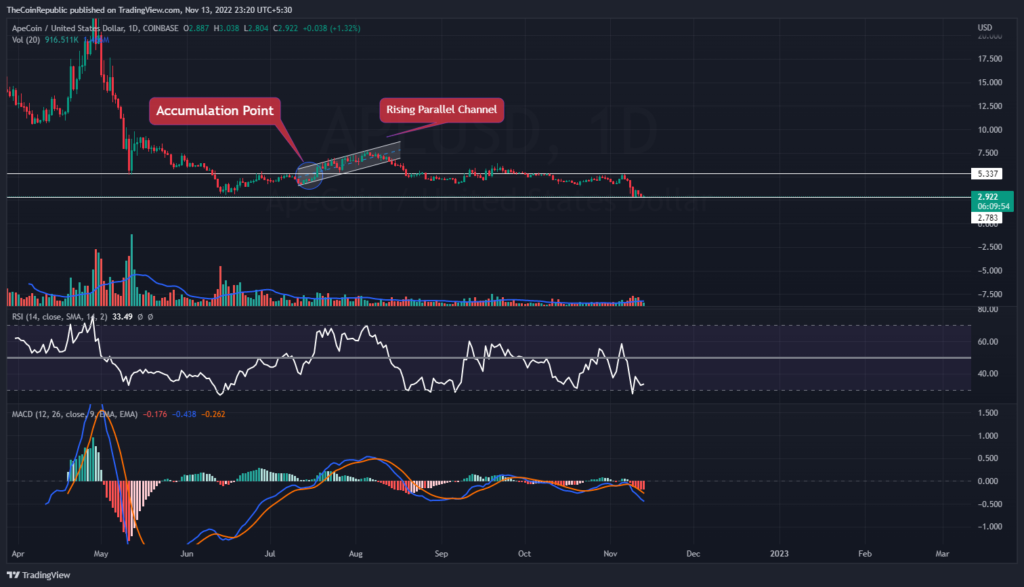
The APE coin’s falling velocity is shown by the Relative Strength Index. The RSI is really near to neutral at 51. The MACD shows the decreasing velocity of the APE coin. The MACD and signal lines may cross in a negative direction during the day’s trading session. APE investors should keep an eye on the daily chart for any shifts in trend.
Conclusion
The daily Apecoin price chart contains several fascinating clues that the price is now declining. The APE cryptocurrency is currently trading at a lower price and is approaching close to its record low, making it challenging for it to gain support. Technical indicators show how quickly the APE currency is losing value. APE investors should keep an eye on the daily chart for any shifts in trend.
Technical Levels
Support Levels: $2.80 and $2.00
Resistance Levels: $3.55 and $5.00
Disclaimer
The views and opinions stated by the author, or any people named in this article, are for informational ideas only, and they do not establish the financial, investment, or other advice. Investing in or trading crypto assets comes with a risk of financial loss.

With a background in journalism, Ritika Sharma has worked with many reputed media firms focusing on general news such as politics and crime. She joined The Coin Republic as a reporter for crypto, and found a great passion for cryptocurrency, Web3, NFTs and other digital assets. She spends a lot of time researching and delving deeper into these concepts around the clock, and is a strong advocate for women in STEM.


