
 Home
Home News
News
- Bitcoin SV Price is trying to recover itself towards the consolidation phase over the daily price chart.
- BSV Crypto has slip[ped below 20, 50, 100 and 200-days Daily Moving Average.
- The pair of BSV/BTC is at 0.002345 BTC with an intraday drop of 3.02%.
The price of Bitcoin SV seems to be dramatically plunging into the bottom zone of the consolidation phase despite the bulls’ best efforts. BSV must first build a sizable bullish support base before ascending to the upper level. After a thrilling ride on the price roller coaster, BSV was positioned on the daily price chart between $43.77 and $65. On the daily price chart, the BSV coin’s value is rising quickly. The cryptocurrency has to move higher and get near to the upper trendline in order to start a breakout. Until bulls maintain their position at the top trendline, investors in BSV must wait. The daily chart shows that the trend for the BSV currency changed after the hammer candle.

Currently, the market value of Bitcoin SV is $38.70, a decrease of 4.75% from yesterday. The trade volume fell by 18.61% during the intraday trading session. This suggests that sellers are trying to build up so they can see the token decompose.

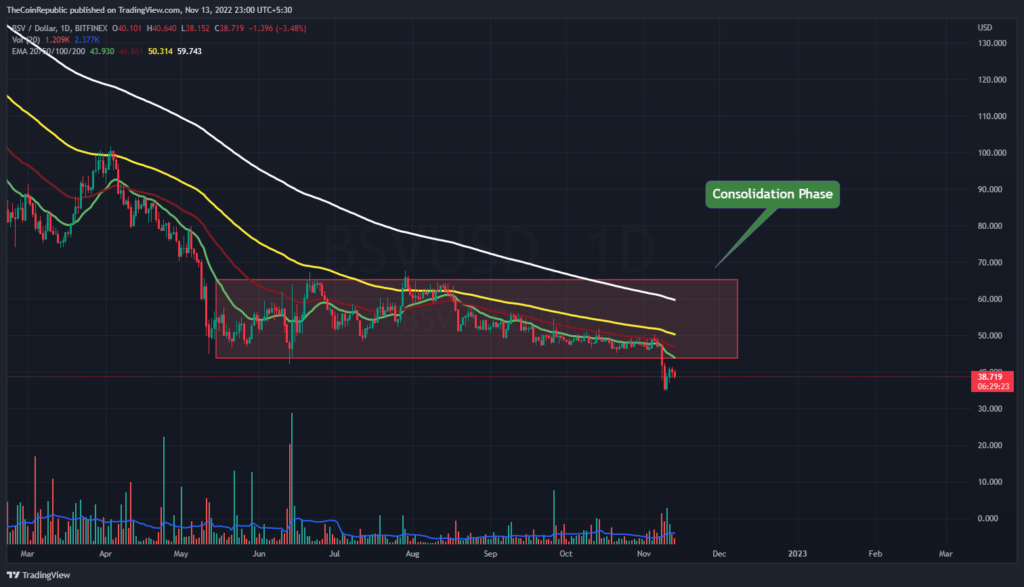
To accelerate toward the upper trendline of the horizontal range-bound area over the daily price chart, the BSV coin price needs to draw in additional buyers. To reverse the trend, the token must attract massive numbers of buyers. But just now, the token is dropping over the daily chart. Volume change must become better for BSV to climb significantly; it is now below average.
What do Technical Indicators suggest about BSV?
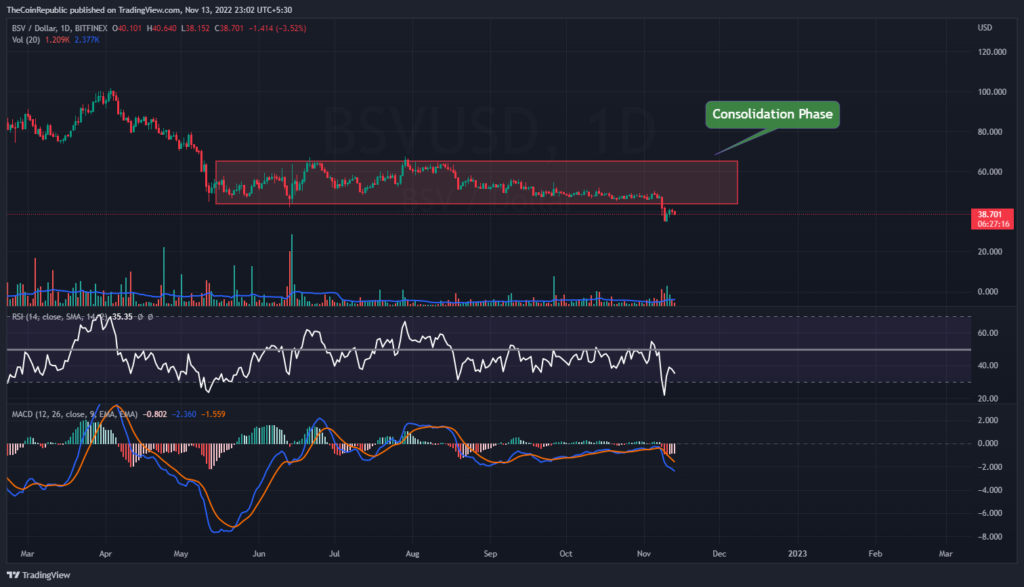
Despite efforts to keep prices under control and attract buyers to the region of the horizontal range-bound market, the BSV currency currently appears to be in the hands of bears. To avoid falling into a short seller’s trap, the token must draw in buyers.
Technical indicators point to a declining momentum for the BSV currency. The relative strength indicator shows the BSV coin’s downward movement. Now, BSV investors with the RSI at 35 must keep an eye out for any directional shifts on the daily chart.
Conclusion
The price of Bitcoin SV seems to be dramatically plunging into the bottom zone of the consolidation phase despite the bulls’ best efforts. BSV must first build a sizable bullish support base before ascending to the upper level. After a thrilling ride on the price roller coaster, BSV was positioned on the daily price chart between $43.77 and $65. Volume change must become better for BSV to climb significantly; it is now below average. Now, BSV investors with the RSI at 35 must keep an eye out for any directional shifts on the daily chart.
Technical Levels
Support Levels: $38.00 and $35.00
Resistance Levels: $44.00 and $50.00
Disclaimer
The views and opinions stated by the author, or any people named in this article, are for informational ideas only, and they do not establish the financial, investment, or other advice. Investing in or trading crypto assets comes with a risk of financial loss.

Andrew is a blockchain developer who developed his interest in cryptocurrencies while pursuing his post-graduation major in blockchain development. He is a keen observer of details and shares his passion for writing, along with coding. His backend knowledge about blockchain helps him give a unique perspective to his writing skills, and a reliable craft at explaining the concepts such as blockchain programming, languages and token minting. He also frequently shares technical details and performance indicators of ICOs and IDOs.


