
 Home
Home News
News
- NEM (XEM) price is trading near its 2-year low.
- This week, buyers pushed the asset value higher, up 5.71% thus far.
- Trading volume increased by 160% to $15.13 million in the last 24 hours.
XEM – the native coin of NEM is finally showing signs of lower recovery on the daily price chart. XEM is getting a positive price rating from the last four trading sessions. In fact, last night (on 19th November) the bulls were extremely aggressive in trading, as a result of which the daily candle moved up by 3.79% and touched a seven-day high of $0.0348.
XEM on Weekly Time Frame
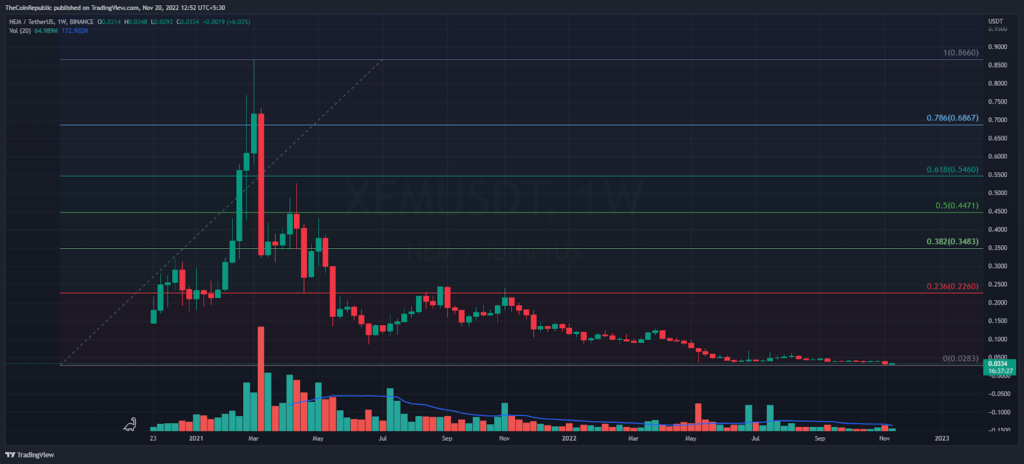
Over the weekly time frame, XEM crypto observes extreme bearish therefore only few buyers exist in live trading session price action shows lower-highs and lower-lows formation since its two year high of $0.8645. Bears follows selling on rise for over the past 20 month, resulting in, XEM noted the two year lowest level at $0.2871 mark on 9 November. As of now, this low level acts as a key demand zone and again price may turn bullish from this level.

At the time of writing, the XEM coin is trading at $0.0333 mark. Market cap is observing into positive region by 5.16% at $300 Million in the last 24 hour. Similarly, trading volume spiked by 160% in the last 24 hours at $15.13 Million.
XEM on Daily TIme Frame

On the daily price scale, XEM is trading in a descending wedge pattern. The proximity of the resistance trendline of this bearish pattern is a major selling point for the bears. Amidst the price recovery, the 20-DMA is acting as an immediate resistance level.
The Stoch RSI indicator is trending towards the overbought zone. The MACD is also going to reflect a bullish crossover as the histogram forms a higher-low on the daily chart.
Conclusion
NEM (XEM) crypto price stopped just below the 20-DMA. At this point, the bulls are gathering more chances to turn this level into support. But the buyers have to struggle a lot to break the major bearish price pattern in the upcoming trading sessions.
Support level – $0.030 and $0.028
Resistance level – $0.420 and $0.060
Disclaimer
The views and opinions stated by the author, or any people named in this article, are for informational ideas only, and they do not establish financial, investment, or other advice. Investing in or trading crypto assets comes with a risk of financial loss.
Steve Anderson is an Australian crypto enthusiast. He is a specialist in management and trading for over 5 years. Steve has worked as a crypto trader, he loves learning about decentralisation, understanding the true potential of the blockchain.


