
 Home
Home News
News

- The price has been on an unceasing descent, even with the newer announcements.
- Exchange reserve and MVRV ratio stood in an optimistic position.
- Chainlink’s social activity hits ATH of around 44,000.
As expected, the Chainlink protocol’s optimism has been an uptick. This could be since the BUILD program partnered with Chainlink’s next protocol upgrade, Chainlink Economics 2.0. It is promoting this new project with full effort, but the same is not very well reflected in the price trends as it shows the other way around.

The char-t-ale
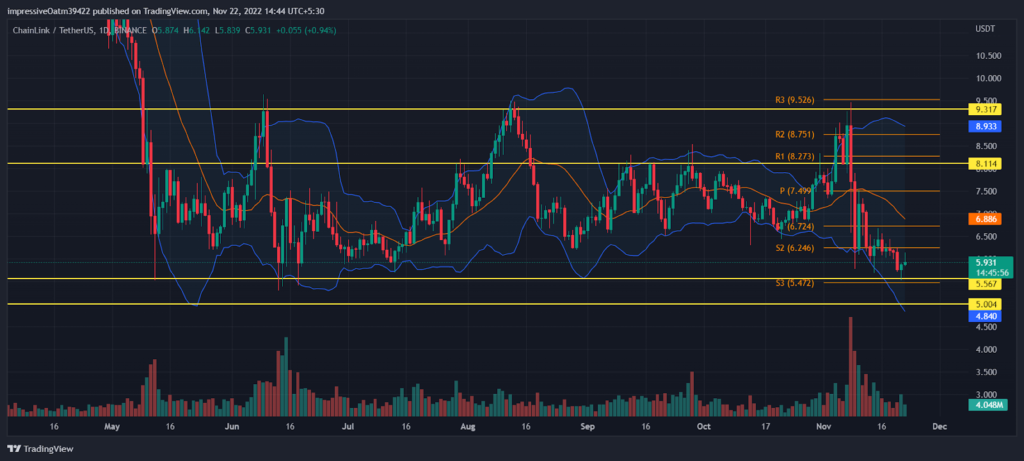
The daily timeframe chart showed that the prices had been declining. The price action is located at the bottom of the central Bollinger Band, indicating volatility. This means that the price will continue to decline from its current position. The $9 area LINK visited at the start of November may be revisited; it can rally and overcome the current resistance levels. If it can build and hold support, a subsequent downtrend could also make its way up the charts.

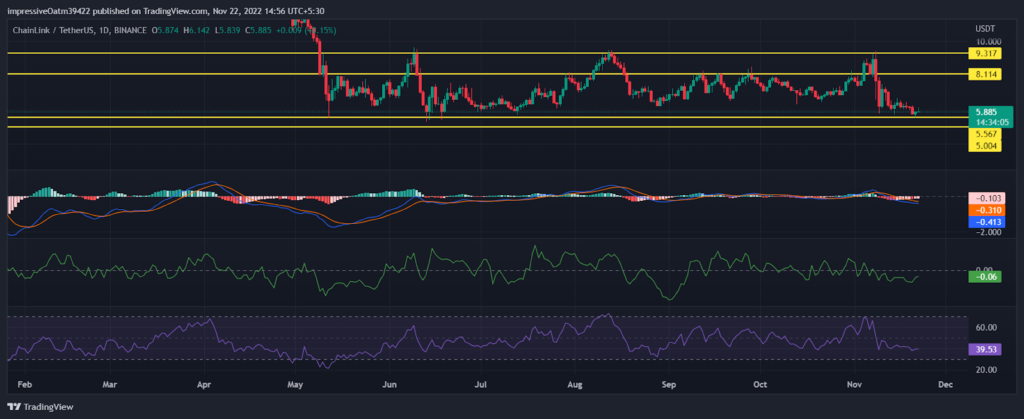
The RSI indicator lays in the 30-40 range and moves horizontally. It may float in the same zone but will not cross the floor limit. The CMF indicator moves close to the 0-level and may even cross it but will float closer to the 0-mark level. The MACD indicator moves intertwined with threads of sales and purchases. It may continue in a similar pattern until the market goes bullish or bearish.
The 4-hour POV
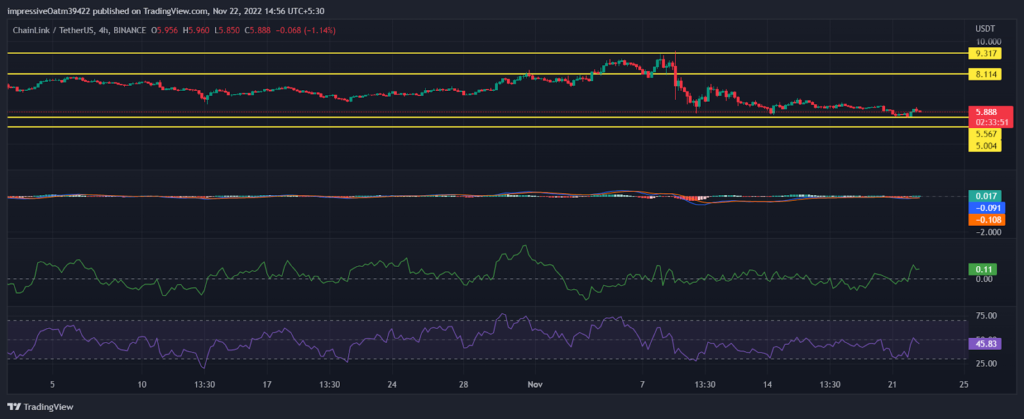
The price continues to slope down. The MACD indicator superimposes the signal line and records a sliver of sales and purchases. It may form the same movement pattern until some major change happens. The RSI indicator moves within the bounds of 30-50. It may move with the same volatility till either bulls or bears take over the market. The CMF indicator is currently near the ceiling but points downwards and may drop closer to the 0-level.
Conclusion
The present market situations are not favorable for LINK, as the social aspects need to sync better with the price patterns. The price patterns suggest a further dip amid the newer projects and prospects. All users can do is wait and see, as the mixed signal may be risky to take any action.
Technical levels
Support levels: $5.560 and $5.000
Resistance levels: $8.110 and $9.310
Disclaimer
The views and opinions stated by the author, or any people named in this article, are for informational ideas only, and they do not establish financial, investment, or other advice. Investing in or trading crypto assets comes with a risk of financial loss.
Steve Anderson is an Australian crypto enthusiast. He is a specialist in management and trading for over 5 years. Steve has worked as a crypto trader, he loves learning about decentralisation, understanding the true potential of the blockchain.


