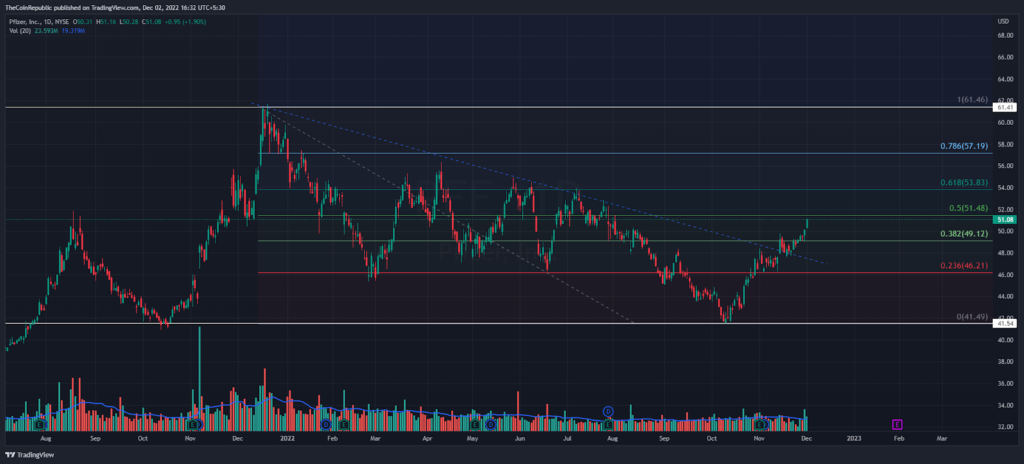
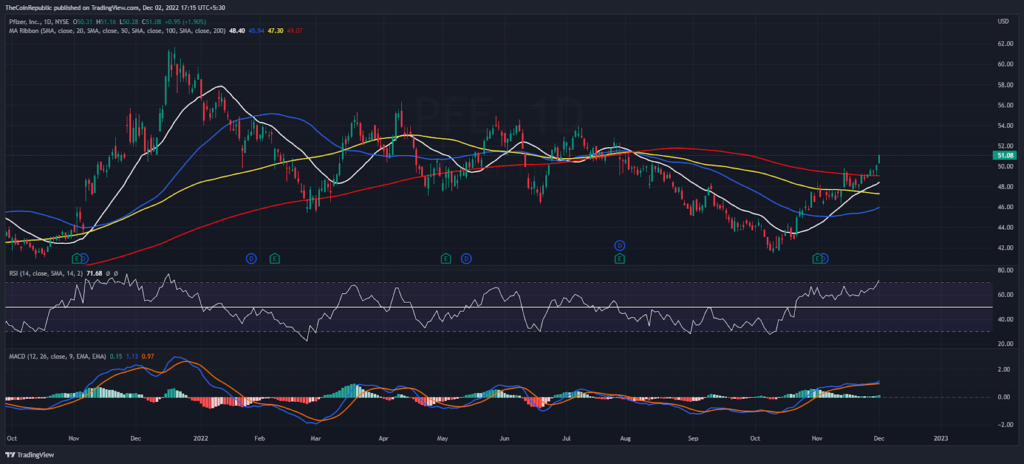
- Pfizer’s share price has been rising steadily since the October low.
- The asset price is about to reach the 0.5 level of the Fibonacci retracement ahead.
- The Relative Strength Index (RSI) is moving into the overbought zone on the daily price chart.
Pfizer share price is rising from its multi-week low. As per the ongoing price action, the asset is in a strong bullish trend after recovering from the 90-day low. There have been only two red candles in the last eight trading sessions and the rest of the trading day saw buyers making money.
Pfizer stock price trend is forming higher-low and higher-high price trend in lower time frame. Speculators have been buying the dip strategy since last month. Since its 90-day low of $41, buyers are still celebrating the bullish rally. Notably, buyers registered a rally of around 22% from December’s high.
Pfizer stock price is skyrocketing nowadays on the behalf of current market trends. This week also the share value stays up by 3.8%. On Thursday 1st December, NYSE: PFE asset price was up 1.9%, closed at $51.08 mark.
Amid higher-highs trend, Asset price is going to hit 0.5 level (close to $52 level) of Fib retracement ahead. Besides, the 0.236 Level of fib appears to be a key defending zone of bulls. Meanwhile trading volume is looking enough for sustaining the bullish momentum. Last night it was reported at 97.03 Million.
In the daily price chart, Pfizer share price remains above all important moving averages. Eventually, the investors escaped the 200 DMA (red), which was the biggest gain for the long term outlook. Later, it flipped to immediate support.
The Relative Strength Index (RSI) has moved into the overbought zone and the MACD is in favor of the bulls as both the dynamic lines remain in the positive zone.
Conclusion
Pfizer share price has a bullish momentum above the $50 support level. The 0.5 Fib retracement level acts as an immediate resistance to break, and buyers above this area can reach the July high of $54.
Technical Levels
Support level – $46 and $40
Resistance level – $54 and $60
Disclaimer
The views and opinions stated by the author, or any people named in this article, are for informational ideas only, and they do not establish financial, investment, or other advice. Investing in or trading crypto assets comes with a risk of financial loss
Steve Anderson is an Australian crypto enthusiast. He is a specialist in management and trading for over 5 years. Steve has worked as a crypto trader, he loves learning about decentralisation, understanding the true potential of the blockchain.


 Home
Home News
News


