
 Home
Home News
News
- The Sandbox price prediction suggests the slow and steady recovery of the token over the daily price chart.
- SAND crypto has recovered till 20 EMA and is preparing for 50, 100 and 20–days Daily Moving Average.
- The pair of SAND/BTC is at 0.00003525 BTC with an intraday gain of 2.64%.
The Sandbox price prediction suggests the token’s consolidation phase over the daily price chart as the token has finally gained support from $0.52. SAND crypto is trying to maintain its uptrend momentum and must surge towards the upper trendline of the consolidation phase. The token must maintain the current accumulation to let the token surge from the consolidation phase. SAND investors need to wait until any directional change over the daily price chart.
The Sandbox price is up 1.42% in market value from the day before and is presently trading at $0.59637 on the CMP. In the course of intraday trading, the trade volume has climbed by 38.85%. The implication is that customers are contacting companies to withdraw SAND Cryptocurrency funds.
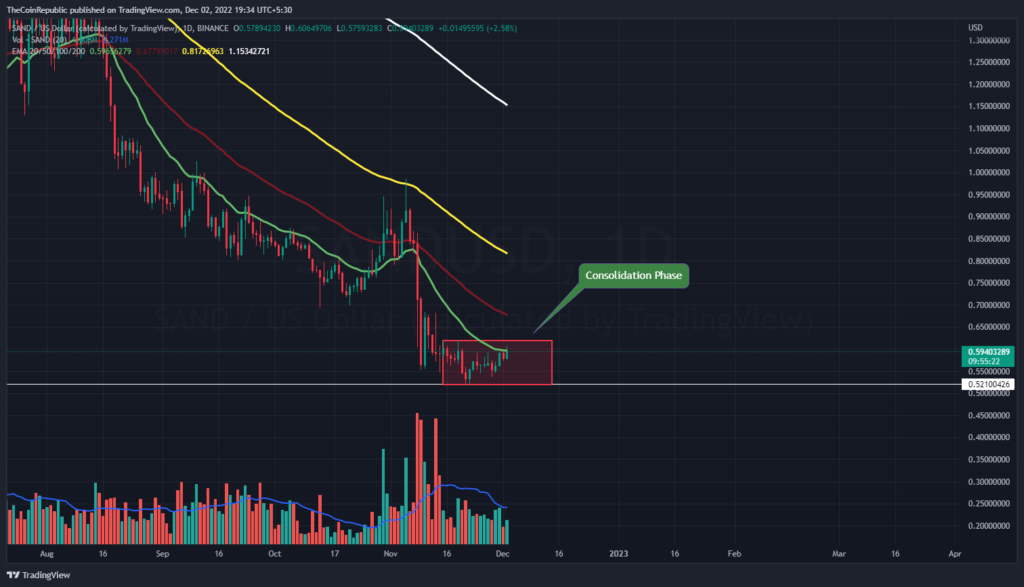
The price of the SAND currency is obviously falling on the daily price chart. The cryptocurrency asset has returned to the consolidation phase near the 2021 lows as a result of the market’s continued decline. More purchasers must enter the market if the price of the SAND currency is to rise back to the higher price range of the consolidation period. SAND’s price has been constant at $0.52 to $0.62 per unit. For SAND currency to cross the daily chart, the volume change, which is now low in comparison to the average, must rise.
What do Technical Indicators suggest about SAND?
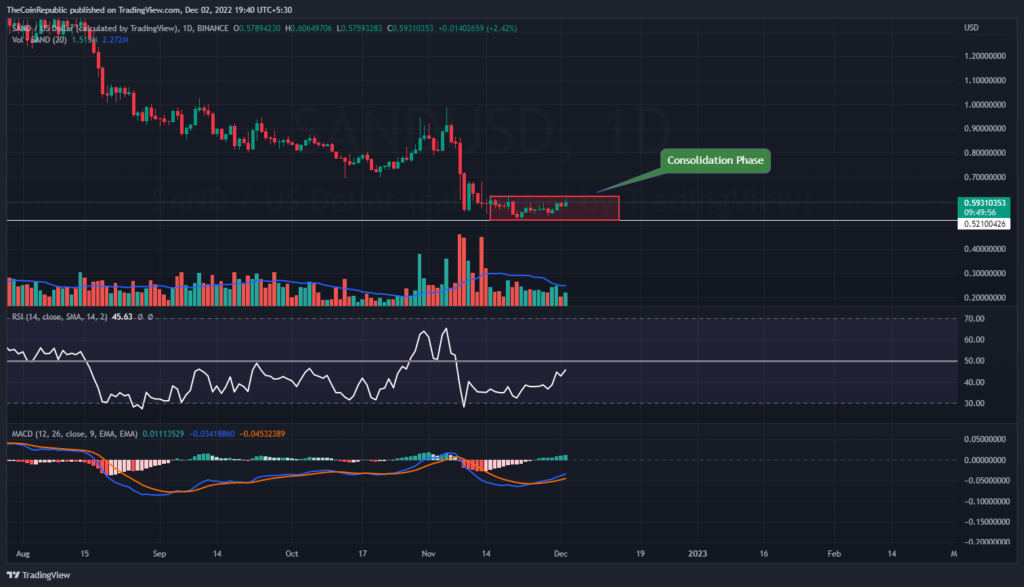
The price of SAND is falling quickly on the daily price chart. The SAND coin has to draw support from buyers in order to quickly rise toward the top price range of the consolidation phase. Technical indicators show how strong the upward trend is for the SAND currency.
The relative strength index shows that the SAND coin is increasing (RSI). The RSI is approaching neutrality at 45. The MACD for the SAND cryptocurrency shows a bullish momentum. The MACD line is above the signal line following a positive crossover. SAND investors should keep an eye on the daily chart for any changes in trend.
Conclusion
The Sandbox price prediction suggests the token’s consolidation phase over the daily price chart as the token has finally gained support from $0.52. SAND crypto is trying to maintain its uptrend momentum and must surge towards the upper trendline of the consolidation phase. SAND’s price has been constant at $0.52 to $0.62 per unit. For SAND currency to cross the daily chart, the volume change, which is now low in comparison to the average, must rise. Technical indicators show how strong the upward trend is for the SAND currency. SAND investors should keep an eye on the daily chart for any changes in trend.
Technical Levels
Support Level: $0.55 and $0.50
Resistance Level: $0.60 and $0.68
Disclaimer
The views and opinions stated by the author, or any people named in this article, are for informational ideas only, and they do not establish the financial, investment, or other advice. Investing in or trading crypto assets comes with a risk of financial loss.

Andrew is a blockchain developer who developed his interest in cryptocurrencies while pursuing his post-graduation major in blockchain development. He is a keen observer of details and shares his passion for writing, along with coding. His backend knowledge about blockchain helps him give a unique perspective to his writing skills, and a reliable craft at explaining the concepts such as blockchain programming, languages and token minting. He also frequently shares technical details and performance indicators of ICOs and IDOs.


