
 Home
Home News
News
- After taking support at a bullish trendline, Kava price started an uptrend again.
- The conceptual round level of $1.0 became a red zone for selling.
- The Volume Oscillator indicator is dipping into negative territory on the daily price chart.
On the daily price scale, the kava price has a positive price structure. The price movement produced an upper-low near the most recent annual low of $0.770. Despite the positive price structure, the bulls frequently failed to break through the market’s narrow range.

The hourly price chart depicts the inner of the weekly chart’s candlesticks. Despite the fact that the whole crypto market was anticipating a miracle during the trading session, KAVA Crypto often failed to alleviate selling pressure. This is because there are fewer purchasers in the lower price bracket. This is the fourth performance of Inside Candles in the previous four weeks.

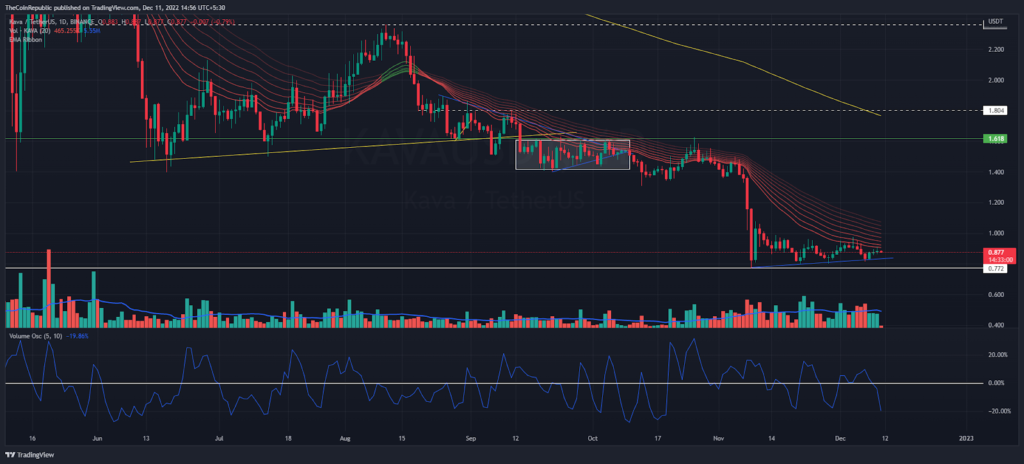
On the daily chart, KAVA token price is holding above an ascending trendline (blue). On the upside, buyers often found higher price rejection at the $1.0 conceptual round level. If the bulls want to defend themselves from one more drop, they will have to put up a lot of fight. Meanwhile, Kava token is trading at the $0.878 mark against USDT at the time of writing.
On the daily chart, KAVA Crypto remains below the red moving lines of the EMA Ribbon indicator. There are several bullish barriers on the upside. Moreover, $0.77 is yet to be re-tested before any significant bounce. Notably, trading volume increased by 108% overnight and was reported at $45.1 million, while the Volume Oscillator indicator was steadily declining into negative territory on the daily price chart.
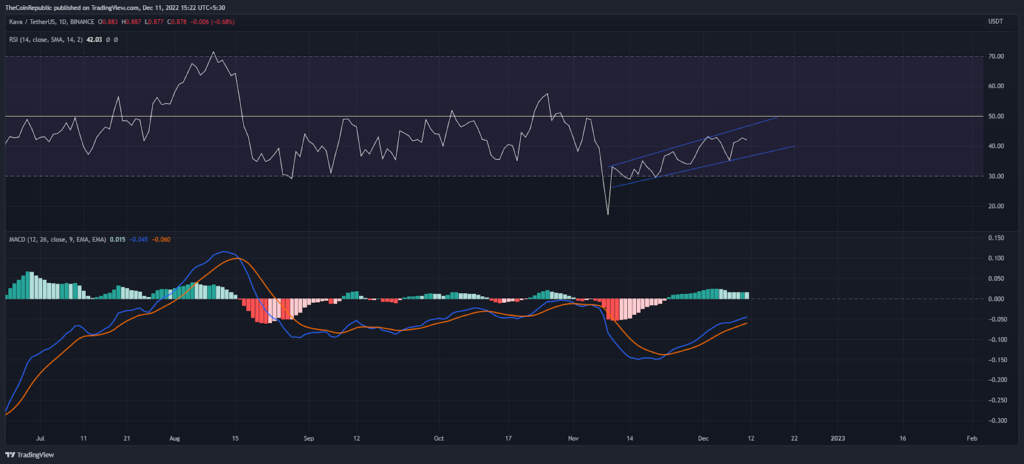
The RSI indicator is operating under an ascending parallel channel on the daily price chart. But it is yet to reach its peak at the semi-line. Similarly, the MACD indicator is expanding more towards the neutral zone.
Conclusion
Despite the bullish price structure on the chart, KAVA token is showing a sideways bias. The buyers need to breach the conceptual round area of $1.0 as soon as possible. Otherwise the bears may drag the crypto price below the support trendline.
Support level – $0.770
Resistance level – $1.0 and $1.8
Disclaimer
The views and opinions stated by the author, or any people named in this article, are for informational ideas only, and they do not establish financial, investment, or other advice. Investing in or trading crypto assets comes with a risk of financial loss.
Steve Anderson is an Australian crypto enthusiast. He is a specialist in management and trading for over 5 years. Steve has worked as a crypto trader, he loves learning about decentralisation, understanding the true potential of the blockchain.


