
 Home
Home News
News

- Shiba Inu Price prediction suggests the consolidation phase of SHIB crypto inside the descending triangle pattern over the daily price chart.
- SHIB crypto is currently trading at 20 EMA but is still below 50, 100 and 200-days Daily Moving Average.
- The pair of SHIB/BTC is at 0.00000000054 BTC with an intraday gain of 0.22%.
The Shiba Inu price prediction points to the token being confined inside the falling triangle formation over the daily price chart. The SHIB coin needs to climb out of its current condition in order to rise above the daily price chart. The token must wait until it leaves the consolidation state and breaks out of the descending triangular pattern before the SHIB army can move in. Over the course of the daily price chart, the price of Shiba Inu went through an exciting roller coaster, initially failing to escape the descending triangle pattern and getting stuck in the consolidation stage. The token was able to escape the consolidation phase after recovering, but it was quickly drawn back into the falling triangle pattern.

The current estimated price of Shiba Inu is $0.00000925, and during the last day, it has lost 0.06% of its value. The volume of trades during intraday trading has increased by 0.04%. This suggests that people looking to buy SHIB cryptocurrency are trying to get the token.

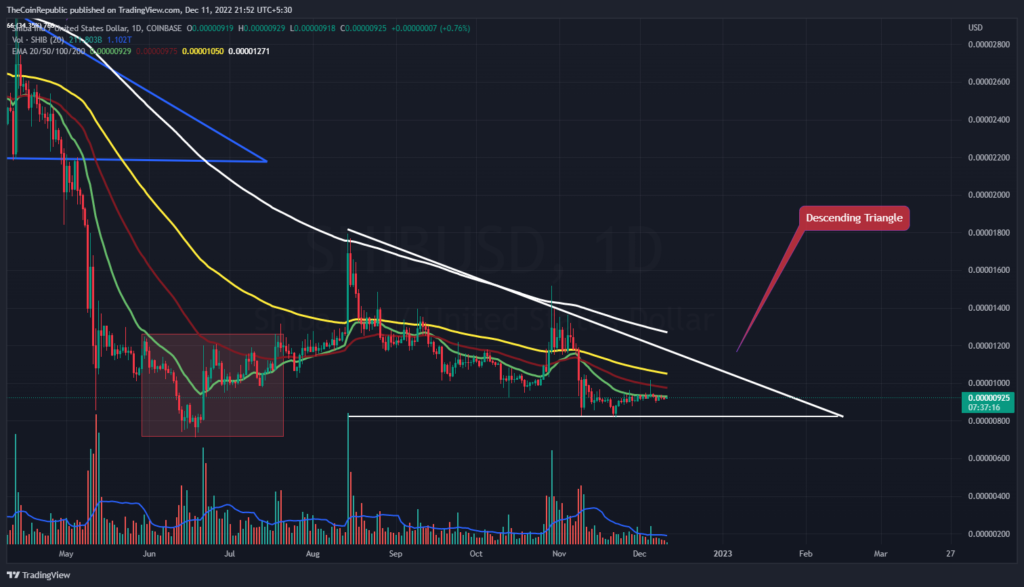
Shiba Inu price prediction showcases that SHIB Crypto’s price has been falling through a descending triangle pattern on the daily price chart. The daily chart for the cryptocurrency SHIB depicts a fantastic roller coaster ride. SHIB must raise the volume change, which is now below average and needs to be raised, in order to break out of the falling triangle pattern.
Will Shiba Inu Price Skip Consolidating?
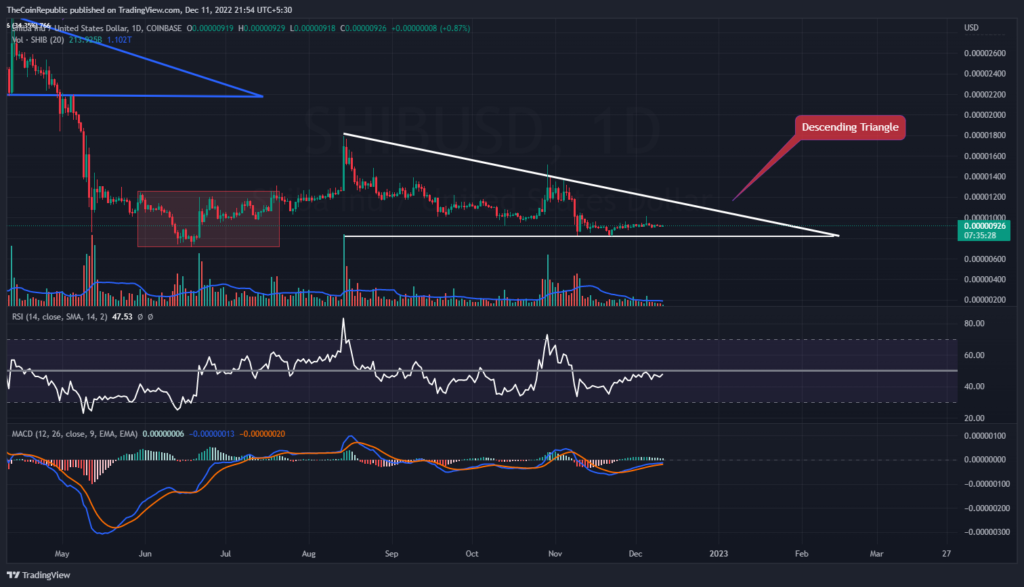
Shiba Inu price needs to exit the falling triangle pattern, and more buyers need to enter the market during intraday trading for the token to move into its recovery phase. Technical indicators support the token’s drop over the course of the daily price chart.
The Relative Strength Index shows the sideways momentum of the SHIB cryptocurrency. At 47, the RSI is stationary below neutrality. In MACD, the sideways momentum of SHIB is apparent. The MACD line is in front of the signal line after a positive crossover. The SHIB army needs to keep an eye out for any noticeable momentum shifts in the token’s price movement.
Conclusion
The Shiba Inu price prediction points to the token being confined inside the falling triangle formation over the daily price chart. The SHIb coin needs to climb out of its current condition in order to rise above the daily price chart. The token must wait until it leaves the consolidation state and breaks out of the descending triangular pattern before the SHIB army can move in. SHIB must raise the volume change, which is now below average and needs to be raised, in order to break out of the falling triangle pattern. The SHIB army needs to keep an eye out for any noticeable momentum shifts in the token’s price movement.
Technical Levels
Support Levels: $0.0000090 and $0.00000820
Resistance Levels: $0.00000965 and $0.00001050
Disclaimer
The views and opinions stated by the author, or any people named in this article, are for informational ideas only, and they do not establish the financial, investment, or other advice. Investing in or trading crypto assets comes with a risk of financial loss.
Steve Anderson is an Australian crypto enthusiast. He is a specialist in management and trading for over 5 years. Steve has worked as a crypto trader, he loves learning about decentralisation, understanding the true potential of the blockchain.


