
 Home
Home News
News

- XOM Stock Price Prediction showcases rigorous fall as selling pressure increases from past few consecutive trading sessions.
- Exxon Mobil Corporation is an American multinational who works in the domain of oil and gas corporations.
- XOM Stock Price has dropped around 8.05% in the last four consecutive trading sessions.
XOM Stock price prediction suggests downtrend momentum of the stock price during the intraday trading session. XOM stock needs to attract more buyers in order to sustain at the current level and must convert the current momentum. XOM investors have been waiting from the last few trading sessions for the stock price to surge back towards the distribution phase. However, short-sellers had never left any chance of pulling the stock price towards the accumulation phase. Distribution phase for XOM stock price is situated at $115, accumulation phase on the lower end is marked at $100 over the daily price chart.

XOM Stock price is currently approximated at $103.54 and has lost 0.88% of its market value during the intraday trading session. Trading volume can be seen under full influence of sellers and it must be reversed for XOM stock price to surge back over the daily price chart.

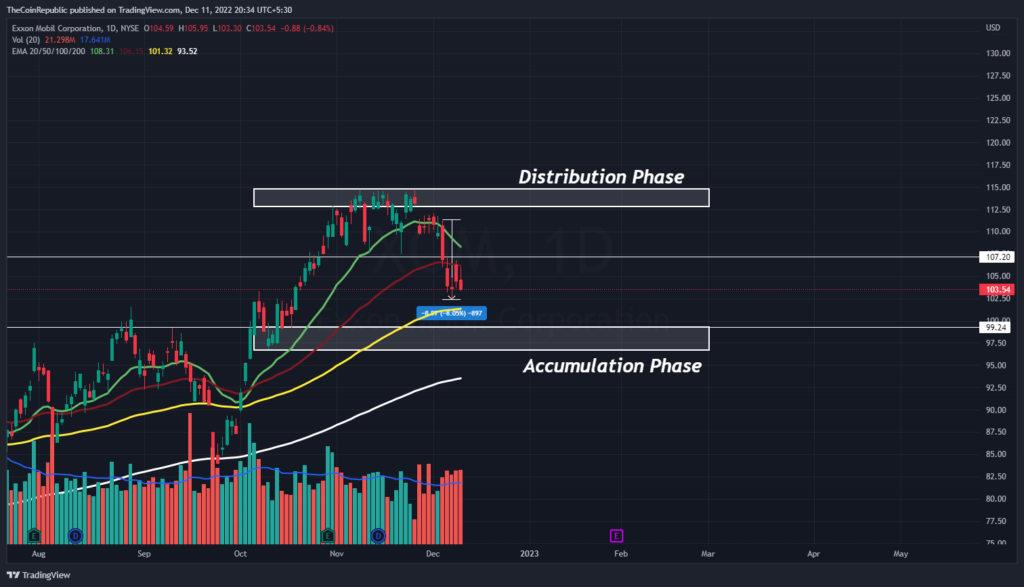
XOM stock price has slipped below 20 and 50 EMA in a week and has been continuously trying to sustain at the current level. However, volume change can be seen above average under full influence of sellers. It’s buyers turn now to mark their entry into the show. Stock price must accumulate more buyers to avoid falling below the accumulation phase over the daily price chart.
Technical Indicators Showing “Fall” of XOM Stock Price in this Winter!
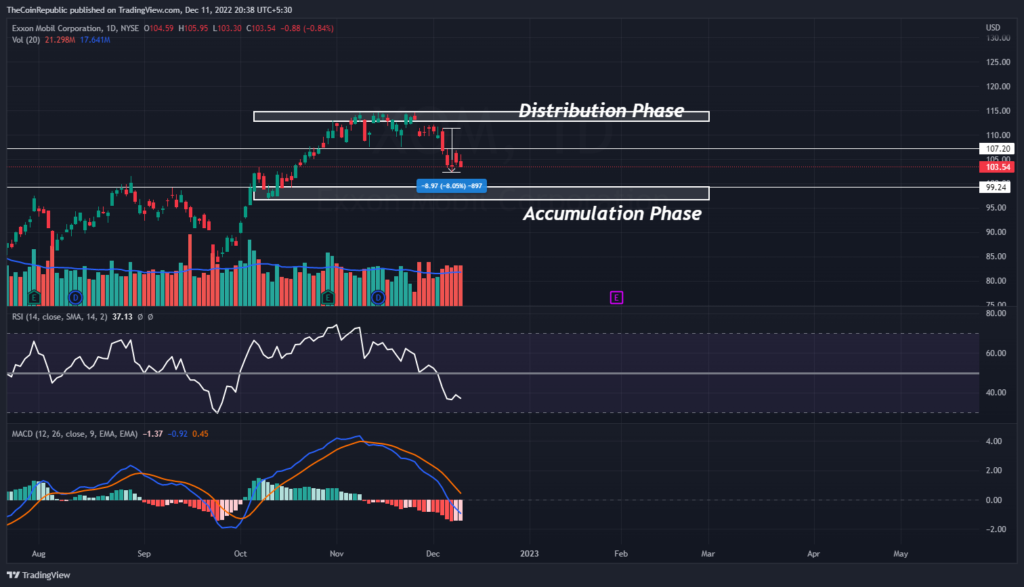
XOM Stock price has been trying to sustain at the current level but it seems like bears are trying way harder for the token to slip over the daily price chart. Technical indicators suggest the downtrend momentum of XOM stock price.
Relative Strength Index showcases the falling momentum of XOM Stock price. RSI is at 37 and is heading to be oversold by the opening of Monday’s trading session. MACD confirms the downtrend momentum of XOM stock. The MACD line is below the signal line after a negative crossover. XOM Stock investors need to wait for any directional change over the daily price chart.
Conclusion
XOM Stock price prediction suggests downtrend momentum of the stock price during the intraday trading session. XOM stock needs to attract more buyers in order to sustain at the current level and must convert the current momentum. XOM investors have been waiting from the last few trading sessions for the stock price to surge back towards the distribution phase. XOM stock price has slipped below 20 and 50 EMA in a week and has been continuously trying to sustain at the current level. Technical indicators suggest the downtrend momentum of XOM stock price. XOM Stock investors need to wait for any directional change over the daily price chart.
Technical Levels
Support Levels: $102.00 and $100.00
Resistance Levels: $107.00 and $110.00
Disclaimer
The views and opinions stated by the author, or any people named in this article, are for informational ideas only, and they do not establish the financial, investment, or other advice. Investing in or trading crypto assets comes with a risk of financial loss.

Andrew is a blockchain developer who developed his interest in cryptocurrencies while pursuing his post-graduation major in blockchain development. He is a keen observer of details and shares his passion for writing, along with coding. His backend knowledge about blockchain helps him give a unique perspective to his writing skills, and a reliable craft at explaining the concepts such as blockchain programming, languages and token minting. He also frequently shares technical details and performance indicators of ICOs and IDOs.


