
 Home
Home News
News
- Solana price prediction suggests the sideways momentum of the cryptocurrency over the daily price chart.
- SOL crypto is trading at 20 EMA and is still below 50, 100 and 200-days Daily Moving Average.
- Solana cryptocurrency must push the trading volume during the intraday trading session.
The Solana price prediction indicates that the SOL coin is moving sideways close to the accumulation phase of the consolidation phase. Investors in SOL token must wait until purchasers assemble and give SOL token a boost before investing. This is because the distribution phase is when SOL token will surge to its higher price range. SOL cryptocurrency from the Solana ecosystem has shown to be a worthwhile investment for cryptocurrency holders worldwide. To allow the token to surge for its recovery phase, SOL traders must wait and demonstrate their confidence in their asset.
The projected price of Solana is currently $13.67, and in the previous day, it increased its market value by 3.65%. The intraday trading session saw a 50.70% increase in trade volume. This shows that customers are approaching to push the price range upward.
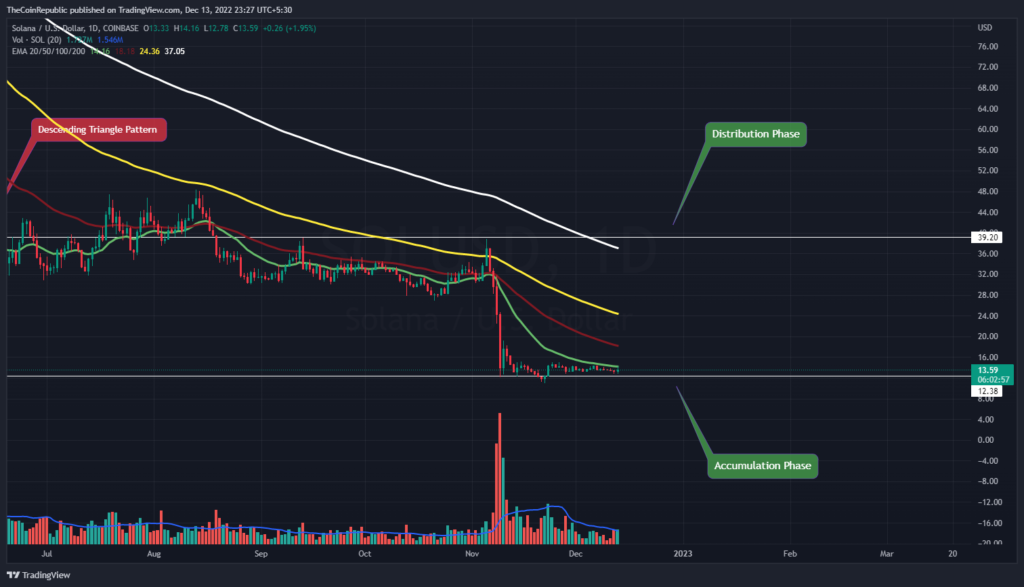
The sideways motion of the SOL cryptocurrency across the daily price chart is suggested by the Solana price prediction. For SOL to accelerate toward the consolidation phase’s upper price range, volume change must increase from its current subpar level. Solana investors must understand the token’s recovery period. Meanwhile, SOL crypto is trading at 20 EMA and is still below 50, 100 and 200-days Daily Moving Average.
What do Technical Indicators suggest about Solana Price?
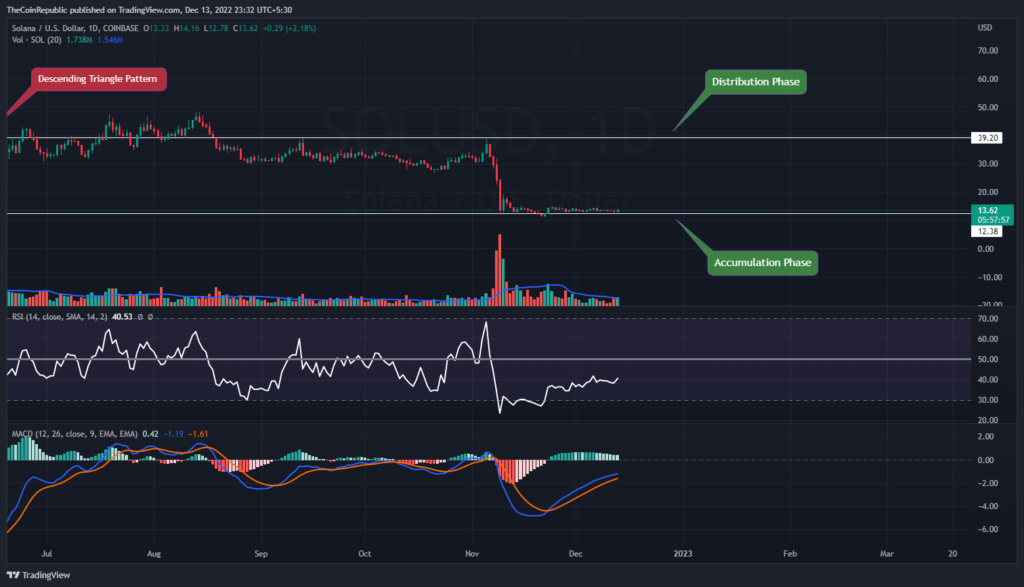
Technical signs point to the SOL cryptocurrency’s sideways movement. The SOL token’s consolidation period is demonstrated by the Relative Strength Index. At 40, the RSI is stationary below neutrality. The sideways motion of SOL tokens is visible on MACD. The signal line representing the sideways momentum and the MACD line are parallel. Investors in SOL must watch the daily price chart for any directional changes.
Conclusion
The Solana price prediction indicates that the SOL coin is moving sideways close to the accumulation phase of the consolidation phase. Investors in SOL token must wait until purchasers assemble and give SOL token a boost before investing. This is because the distribution phase is when SOL token will surge to its higher price range. Solana investors must understand the token’s recovery period. The signal line representing the sideways momentum and the MACD line are parallel.
Technical Levels
Support Levels: $12.50 and $10.80
Resistance Levels: $15.20 and $20.00
Disclaimer
The views and opinions stated by the author, or any people named in this article, are for informational ideas only, and they do not establish the financial, investment, or other advice. Investing in or trading crypto assets comes with a risk of financial loss.

With a background in journalism, Ritika Sharma has worked with many reputed media firms focusing on general news such as politics and crime. She joined The Coin Republic as a reporter for crypto, and found a great passion for cryptocurrency, Web3, NFTs and other digital assets. She spends a lot of time researching and delving deeper into these concepts around the clock, and is a strong advocate for women in STEM.


