
 Home
Home News
News

- IOTA formed bullish hammer candle near yearly low, with a higher volume
- RSI approaching oversold zone whereas MACD may generate negative crossover
IOTA prices had trading near to yearly lows with mild bearish cues. In the previous session IOTA formed a bullish hammer candle and up by 0.89% but in the last few hours bulls lost the previous gains and down by -2.54%.The last 24 hours volume up by 102% and volume to market cap ratio stood at $0.0311

Higher time frame narrative
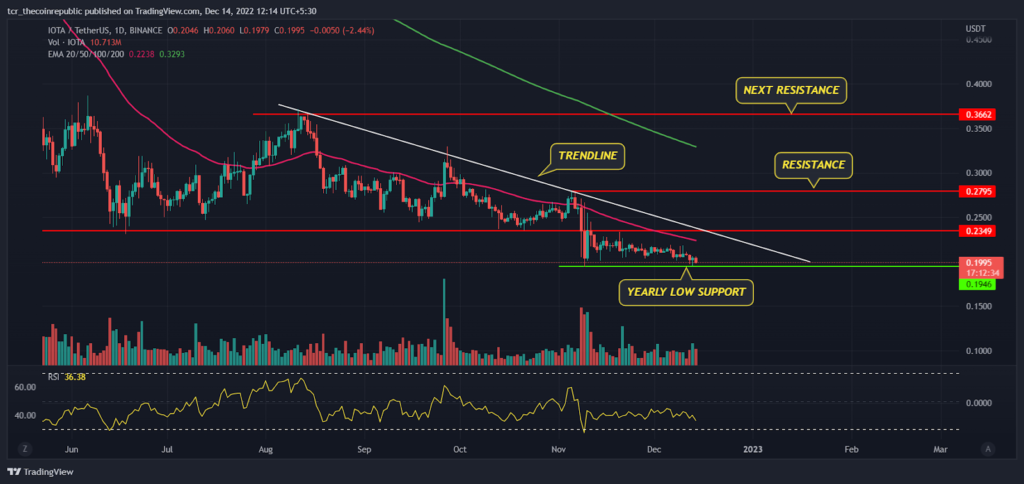
On a higher time frame, IOTA prices had been quite volatile and trading in the range between $0.2349 to $0.3662 from the past couple of months. In June prices picked up some positive momentum but faced resistance in the higher zone at $0.3662, later in the mid August, selling pressure got triggered and IOTA bulls lost all the previous gains.

Recently, due to an unfavorable scenario in the crypto market IOTA slipped below its lower range and created a new yearly low at $ $0.1938, after a little bit consolidation in a tight range, prices again attempting recent lows and forming a bullish hammer candle.
The 200 day ema(green) sloping downwards indicates a positional trend to remain weak in coming months. The 50 day ema (pink) at $.2238 will act as an immediate hurdle for bulls followed by the next hurdle will be a falling trendline and breakdown level $0.2349 and $0.2795.
Smaller time frame narrative
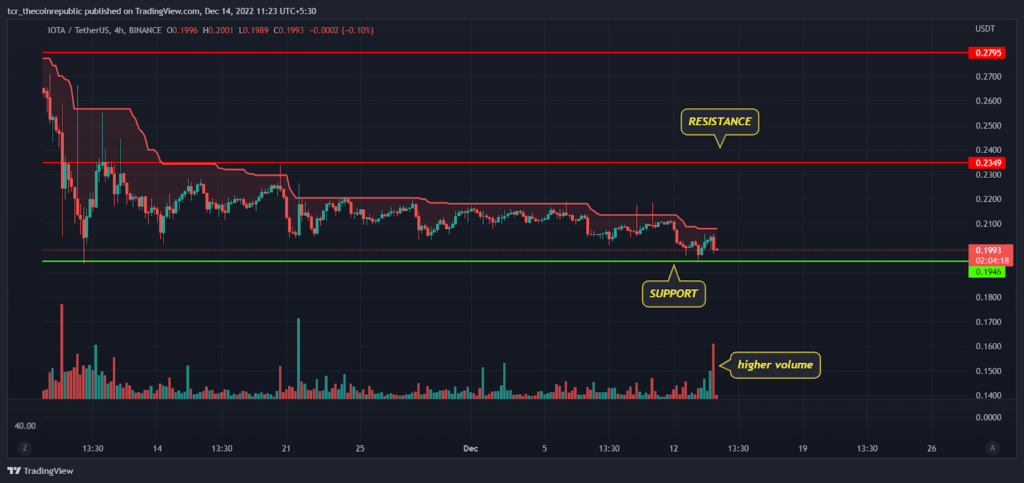
On a lower time frame, IOTA prices look stable and trading in the tight range between $0.1946 to $0.2349 which is likely to break either side in coming days. Super trend indicator generated sell signal and continuing trailing down, which indicates short term trend is still on bear grip.
MACD
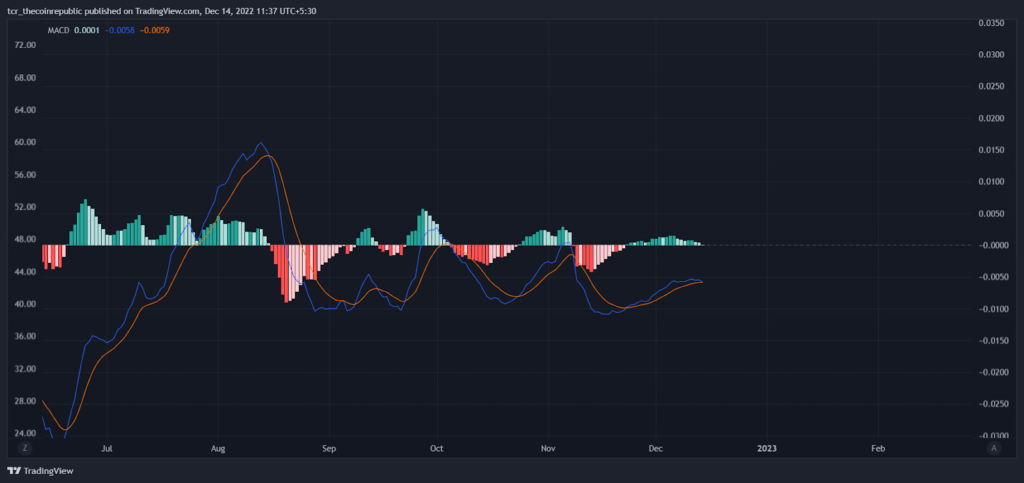
The MACD indicator had shown some strong recovery in the past couple of months but later in mid August it generated negative crossover and slipped below zero line. Since then bulls had tried multiple times to trade above zero line but were unable to sustain higher levels. Currently, MACD is again on a way to generate negative crossover.
Summary
IOTA has been in a strong downtrend for quite a long time and bulls are struggling to defend the yearly lows. As of now, price analysis does not indicate any trend reversal but if prices sustain above $0.1946 we may see some relief rally in coming days. The aggressive traders and investors both should avoid creating any buying positions in the lower levels.
Technical levels
Resistance levels : $0.2795 and $0.3662
Support levels : $0.1946 – $0.1500
Disclaimer
The views and opinions stated by the author, or any people named in this article, are for informational ideas only, and they do not establish financial, investment, or other advice. Investing in or trading crypto assets comes with a risk of financial loss.

Andrew is a blockchain developer who developed his interest in cryptocurrencies while pursuing his post-graduation major in blockchain development. He is a keen observer of details and shares his passion for writing, along with coding. His backend knowledge about blockchain helps him give a unique perspective to his writing skills, and a reliable craft at explaining the concepts such as blockchain programming, languages and token minting. He also frequently shares technical details and performance indicators of ICOs and IDOs.


