
 Home
Home News
News
- Qualcomm Inc stock reclaim 50 day ema with big bullish candle, indicating short term trend reversal.
- Supertrend generated buy signal, MACD sustaining above zero line and RSI indicating more strength in coming days.
Qualcomm Inc stock has been reversing upwards with mild bullish cues, after forming a bullish engulfing candle. The stock reclaimed the 200 week ema and had gained some positive momentum. Currently, the stock is up by 3.73% on a weekly basis and likely to breakout on a higher side.
Weekly time frame narrative
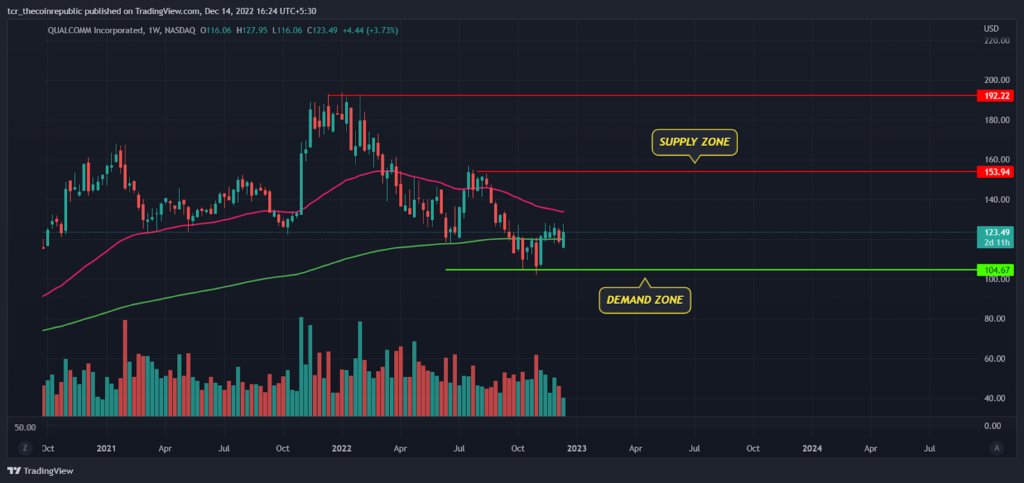
On a weekly time frame, Qualcomm Inc stock has been in downtrend and slipped below both the 50 and 200 week exponential moving averages which has derived a negative sentiment in the past couple of months. Recently, in November first week qualcomm formed a bullish engulfing candle and reclaimed 200 weeks ema(green) at $120 indicates genuine buyers are accumulating the stock at lower levels and expecting a more upside in coming weeks.
Daily time frame narrative
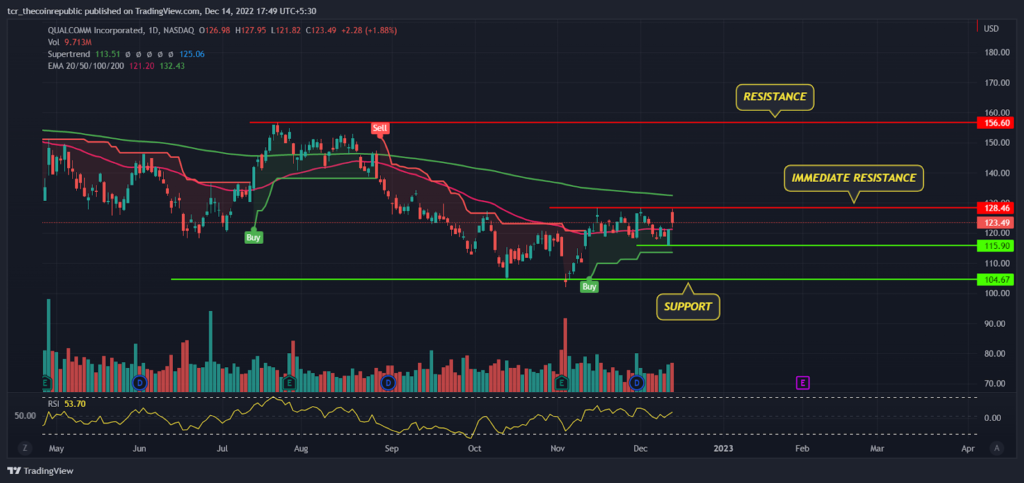
On a daily time frame, the Qualcomm Inc stock price is forming a double bottom pattern and consolidating near the neckline. In the month of July bulls gained some positive momentum and created a high near $156 but after a little bit of range bound days, bulls lacked the control over prices and lost all the previous gain and tested a 52 week low at $102. In november stock formed a Doji candle near demand zone and prices recovered almost 20% which indicates short term trend reversal.
As of now, prices are trading in a tight range between $115 to $138 and likely to breakout upside in coming weeks.The supertrend indicator had generated a buy signal and RSI at 53 pointing upside also in the favor of bulls. Meanwhile, The bulls had successfully reclaimed 50 day ema (pink) sloping sideways indicates bulls may be trying to create a short term base formation before the next move arrives. The 200 day ema(green) sloping sideways will act as an immediate hurdle for bulls in coming days followed by next will be $150 which is almost 22% upside from the current levels.
MACD
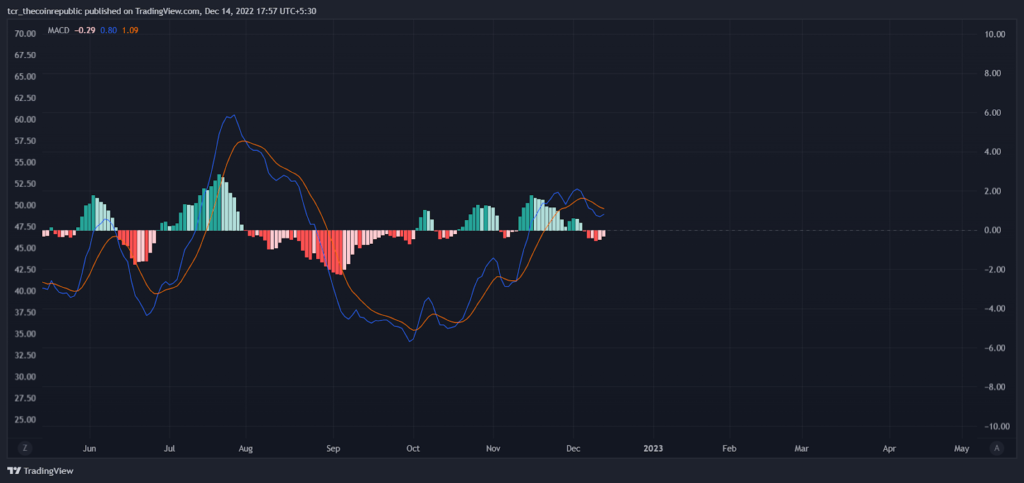
Recently, MACD had given positive crossover and sustaining above zero line supported by higher highs histogram bars shows more strength may arrive in coming days and minor correction will be an opportunity to accumulate Qualcomm at lower levels.
Summary
Global chipmaker Qualcomm Inc has disappointed its investors in the current year but as we move forward to 2023, the company is launching its new services which grabbed the attention of investors and looks like stock is getting accumulated at lower levels. The technical parameter also indicating mild bullish So, traders and investors must look for buying opportunity in lower levels for the target of $156 and above by keeping $104 as SL
Technical levels
Resistance levels : $130.00 and $156.00
Support levels : $115.00 – $102.00
Disclaimer
The views and opinions stated by the author, or any people named in this article, are for informational ideas only, and they do not establish financial, investment, or other advice. Investing in or trading crypto assets comes with a risk of financial loss.

Nancy J. Allen is a crypto enthusiast, with a major in macroeconomics and minor in business statistics. She believes that cryptocurrencies inspire people to be their own banks, and step aside from traditional monetary exchange systems. She is also intrigued by blockchain technology and its functioning. She frequently researches, and posts content on the top altcoins, their theoretical working principles and technical price predictions.


