
 Home
Home News
News
- Solana price is about to break the descending trendline.
- The bulls are likely to reach the $20 mark soon.
- The market capitalization increased by 6% overnight, registering $5.09 billion.
Solana had crashed earlier in November due to the FTX collapse. Hence, the price of Solana fell by almost 60% in a single week, which forced many retail investors out of the market. This sharp decline dragged the crypto down until the price reached a yearly low of $10.94 on 22 November.

Amidst the bloodshed, buyers lost both short-term and long-term support levels, which turned into upcoming bullish hurdles. So far, the bulls have placed buy orders at the round level, as buyers below this level may lose all dominance for the long-term outlook.

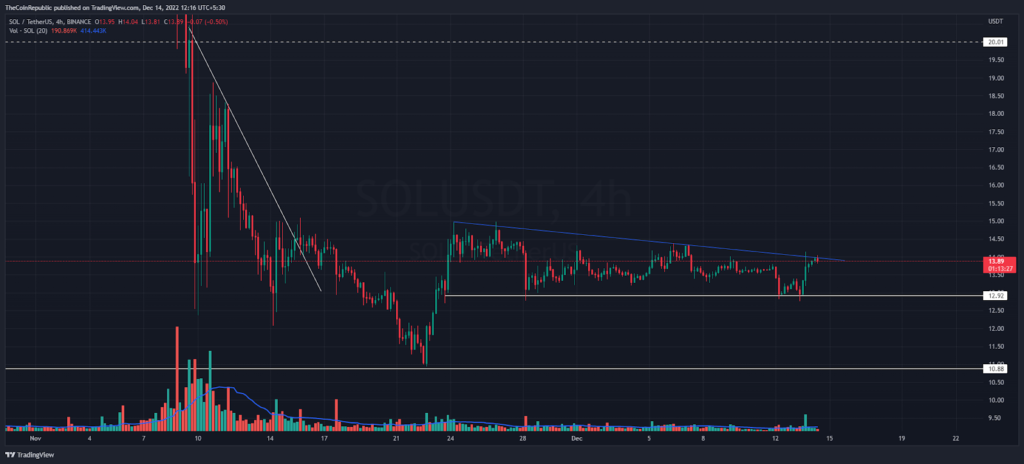
The 4 Hour chart suggests an upcoming bullish breakout in Solana price soon, which will drive positive momentum towards the next round level of $20 before any significant drop. Buyers are managing asset value above $13 level to save themselves. In the upper area, bears have a downsloping trendline to keep SOL in their dominance so far.
Notably, hourly price structure registered double bottom, enough positive indication for bullish breakout. Meanwhile, Solana price stays at horizontal resistance (BLUE) while price trades at $13.93 mark at the time of writing. Meanwhile, Market capitalization rose 6% overnight, recorded at $5.09 Billion.
Trading volume is low nowadays because of the range-bound market. Overnight it increased 72% at $312 Million. Hence, Solana price reaches towards the 20 day exponential moving average where bulls are barely trying to break this level.
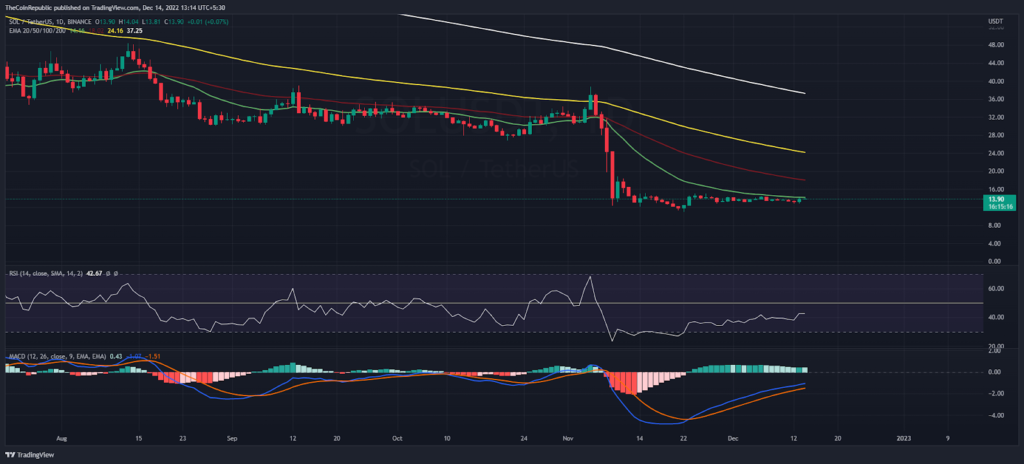
In the context of the daily chart, RSI is gradually increasing higher towards the 50 mark. Above 50 mark, bulls may push Solana price aggressively. Similarly, MACD indicator continuously increases to break through the negative region as soon as possible.
Conclusion
Solana price trades at cheaper levels. Now bulls have an opportunity to gather altcoins for long-term investment. However, technical indicators favor positivity in daily price charts.
Support level – $10
Resistance level – $15 and $20
Disclaimer
The views and opinions stated by the author, or any people named in this article, are for informational ideas only, and they do not establish financial, investment, or other advice. Investing in or trading crypto assets comes with a risk of financial loss.
Steve Anderson is an Australian crypto enthusiast. He is a specialist in management and trading for over 5 years. Steve has worked as a crypto trader, he loves learning about decentralisation, understanding the true potential of the blockchain.


