
 Home
Home News
News

- Flow’s blockchain NFT trading has declined more shapely than other popular networks which affected the Flow prices
- Flow prices forming lower lows candlesticks indicates bearish pattern
- RSI below 30 entered the oversold zone, whereas MACD and supertrend are still bearish.
Flow Blockchain prices are trading with bearish cues and down by 2% in the last 24 hours, hitting a new low at $0.877 while on a weekly basis, prices are down by 10.18% which shows bearish dominance on higher levels.

Larger time frame narrative
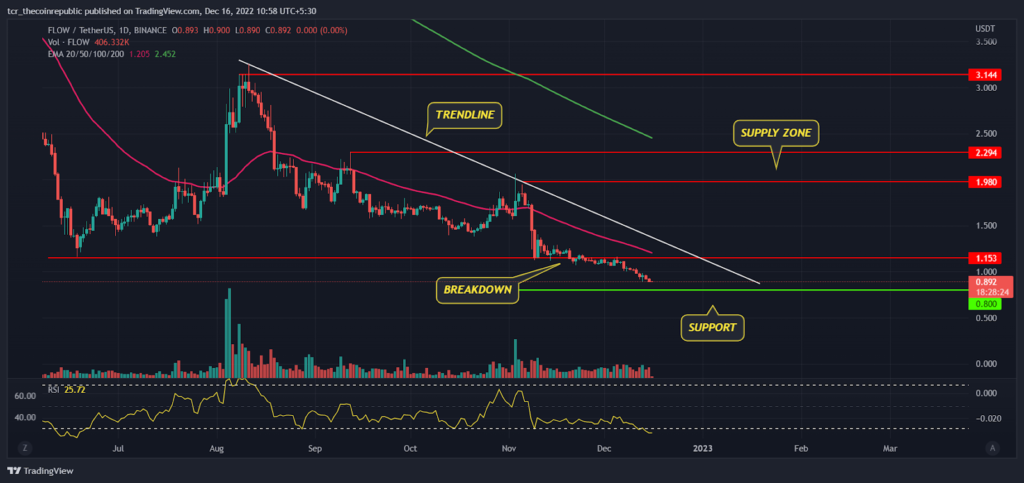
On a larger time frame, Flow shows a strong downtrend implying bears are continuously dominating at higher levels. In June, the price level took support at $1.153 and bounced back sharply forming a strong bullish candle but later it faced resistance at $3.144 and lost previous gains.

In the past couple of months the price level was in the $1.153 to $2.294 range but recently it broke the lower range and slipped below $1 which triggered more negative sentiment. Now, the candles are forming lower lows on a consistently.
The 200-day EMA (green) and trendline (white) sloping downwards indicate that the price level will remain weak on a positional basis. The 50-day EMA (pink) at $1.205 will act as an immediate resistance in the coming weeks. The next will be the $1.500 and $1.980 range.
Smaller time frame narrative
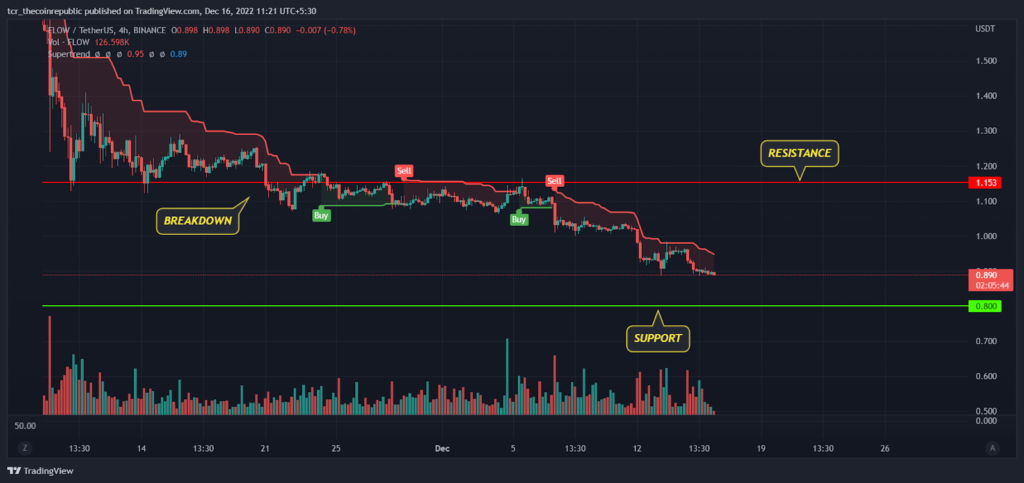
On a smaller time frame, FLOW’s price behavior looks similar to its higher time frame. Prices are slowly and steadily slipping down and may take support at $0.800. The super trend indicator had generated a sell signal indicating a short term trend to remain weak in the coming days till bulls reclaim $1. As of now prices do not indicate any signs of strength so traders should avoid buying the coin at lower levels.
MACD
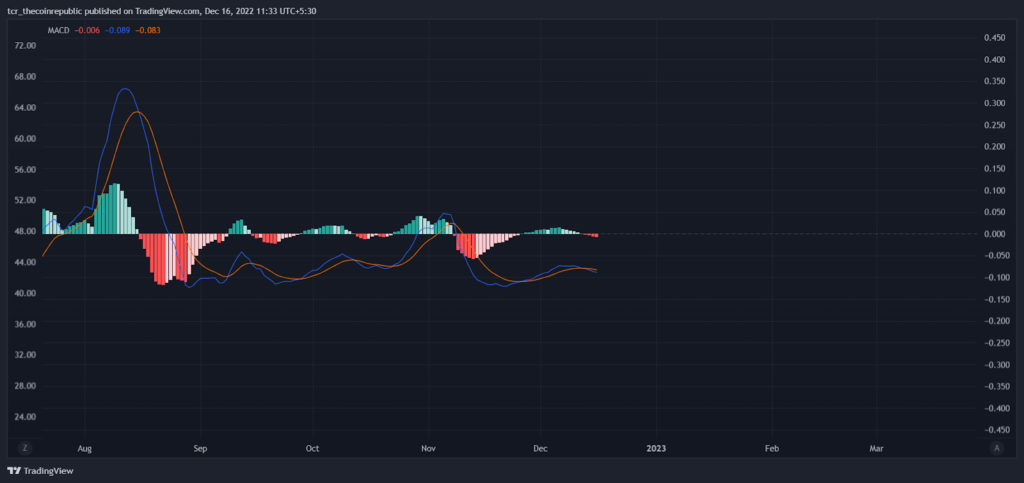
MACD had been mildly bullish in the month of August, but later prices turned bearish, showing a sharp negative crossover and slipping below zero line. Currently, it is trading below the zero line and is likely to develop a negative crossover.
Summary
Flow’s accelerated decline to $1 and lower are due to multiple factors like declining volume in NFT trading, layoffs at Drapper Labs as well as technical indicators which are also bearish and do not show any signs of an upside reversal. Some traders and investors must avoid putting their money on Flow at current levels. If bulls succeed in reclaiming $1.153, Flow may witness a relief rally and a short term trend reversal.
Technical levels
Resistance levels : $1.153 and $1.980
Support levels : $0.800 and $0.500
Disclaimer
The views and opinions stated by the author, or any people named in this article, are for informational ideas only, and they do not establish financial, investment, or other advice. Investing in or trading crypto assets comes with a risk of financial loss.

Andrew is a blockchain developer who developed his interest in cryptocurrencies while pursuing his post-graduation major in blockchain development. He is a keen observer of details and shares his passion for writing, along with coding. His backend knowledge about blockchain helps him give a unique perspective to his writing skills, and a reliable craft at explaining the concepts such as blockchain programming, languages and token minting. He also frequently shares technical details and performance indicators of ICOs and IDOs.


