
 Home
Home News
News

- Chiliz forming Double top bearish pattern, with lower lows candle formation on weekly basis but volume keeps on declining.
- The 200 day and 50 day ema negative crossover whereas RSI 34 may enter oversold zone
Chiliz had been an underperformer and down by almost 17% on a monthly basis and still prices do not indicate any signs of reversal. As per coinglass, Perpetual CHZ longs stood at 11.43M (52.98%) and short buildup was at 10.11M (46.93%) surprisingly, long buildup is higher than shorts but still prices are on decline. On a last 24 hours CHZ/USDT is down by 6.13% and 24h volume to market cap ratio stood at 0.2542.

What charts are revealing ?
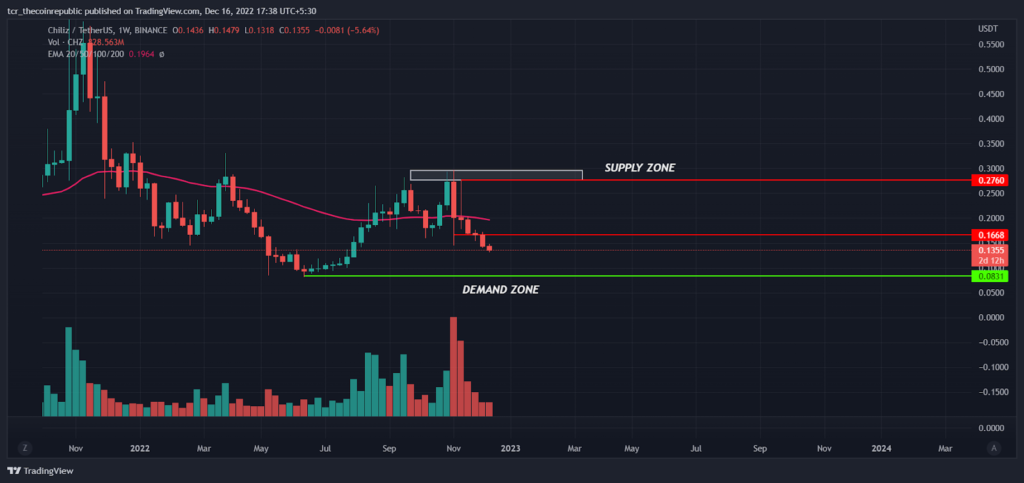
On a weekly time frame, Chiliz looks highly bearish and continuously forming lower lows from past 6 weeks with a deep bearish candle, but surprisingly the volume keeps on declining indicates less sellers are available on lower labels and we may see some relief rally in coming weeks. As of now, the immediate hurdle will be previous week high at $0.1668 and the strongest support is almost 38% down from current levels at $0.0831.

Bearish pattern on daily time frame
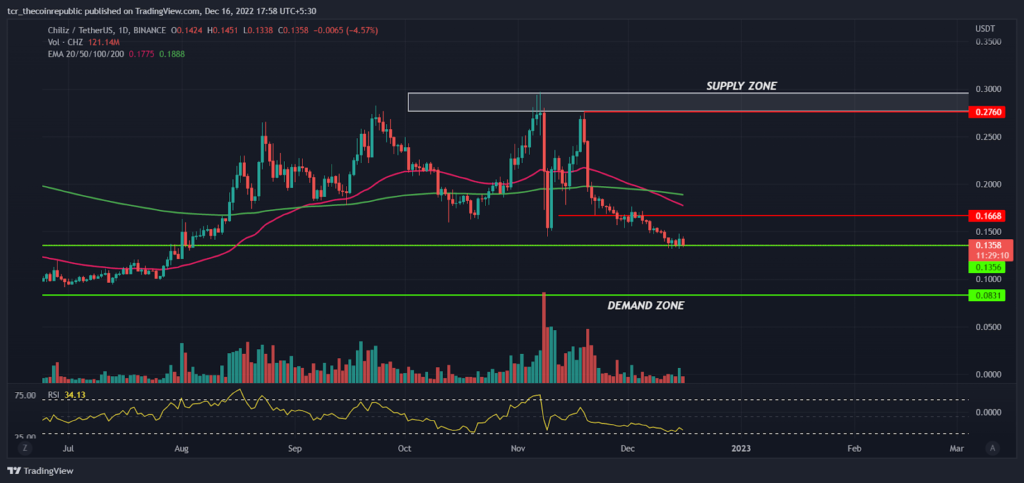
On a daily frame, CHZ had been highly volatile and traded in the range between $0.1356 to $0.2760 but even after trying multiple times bulls unable to sustain higher levels shows bears are on dominance. The 200 day ema (green) negatively crossed 50 day ema (pink) indicates trends to remain weak on a positional basis. The immediate resistance for bulls will be $0.1668 and next will be $0.2000
The RSI at 34 sloping down indicates prices may enter oversold zones and will see some relief rally in coming weeks, but traders must not blindly believe the signal as sometimes prices may trade below 20 for quite a long time. As of now price analysis does not indicate any signs of trend reversal So, traders may look for sell on rise opportunity on higher levels.
Summary
Chiliz has been disappointing the investors for a long time and the prices are continuously slipping down on a daily basis. So, traders and investors should avoid buying at current levels and look for shorting opportunities on higher levels as prices may have a high probability of testing yearly lows $0.0831 again.
Technical levels
Resistance levels : $0.1688 and $0.2760
Support levels : $0.0831 and $0.0500
Disclaimer
The views and opinions stated by the author, or any people named in this article, are for informational ideas only, and they do not establish financial, investment, or other advice. Investing in or trading crypto assets comes with a risk of financial loss.

Andrew is a blockchain developer who developed his interest in cryptocurrencies while pursuing his post-graduation major in blockchain development. He is a keen observer of details and shares his passion for writing, along with coding. His backend knowledge about blockchain helps him give a unique perspective to his writing skills, and a reliable craft at explaining the concepts such as blockchain programming, languages and token minting. He also frequently shares technical details and performance indicators of ICOs and IDOs.


