
 Home
Home News
News
- Pancakeswap rejected 50 day ema and breakdown its previous week low with deep bearish candle
- PancakeSwap introduced farms on Aptos but prices had reacted negatively and forming lower lows candles
PancakeSwap had performed well in the past but recently it broke its important support levels with a strong bearish candle and is likely to see further downside in coming days.
As of now, CAKE/USDT is trading positive with the gains of 2.41% and 24 hour volume to market cap ratio stood at 0.0921
Will the Pancake go further down ?
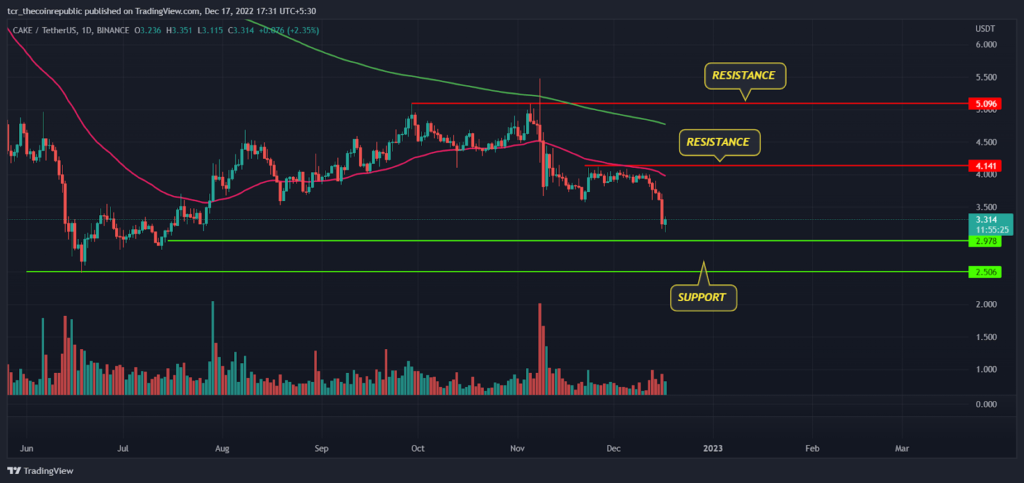
On a higher time frame, PancakeSwap had performed well in the past 6 months. From the mid June CAKE had gained positive momentum and bulls able to reclaim 50 day ema and continued its upside rally but faced resistance at $5.096. In the month of November bulls attempted to go further upside but FTX collapse triggered negative sentiment in the crypto industry which also impacted the CAKE prices and bears succeeded to reverse the trend down.
The 200 day ema (green) sloping down indicates a trend to remain weak on a positional basis and the 50 day ema(pink) at $3.982 will act as an immediate hurdle for bulls on coming days followed by next resistance at $5.096.
The closer window
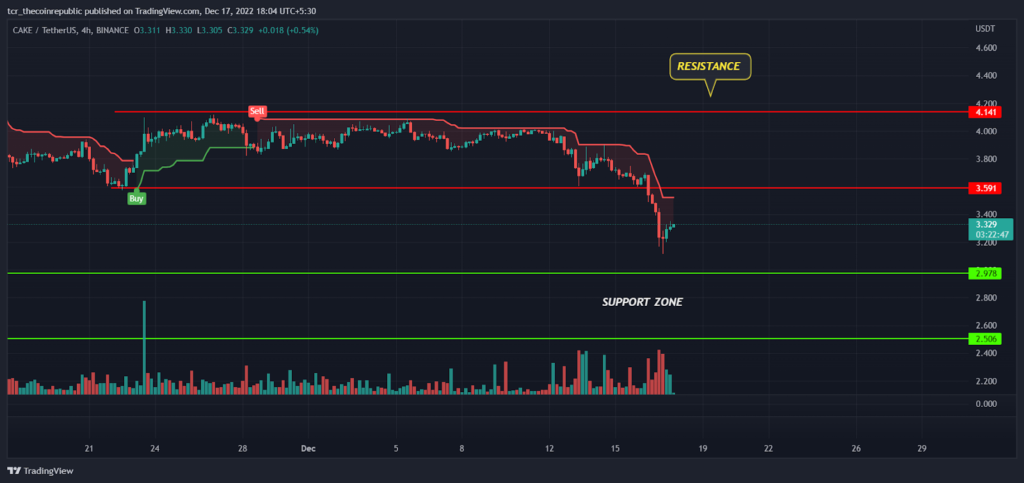
On a lower time frame, CAKE prices had been trading in the tight range between $3.591 to $4.141 but recently it broke down its lower range and slipped below $3.591 support level which indicates sellers had taken control on higher levels.The supertrend indicator had generated sell signal and continue to trail down indicates short term trend to remain weak till any bullish candle close above supertrend red line. On a lower side prices may approach the support zone of $2.978 and show signs of upside reversal , but if prices slipped below $2.978 we may see further down side towards $2.506
MACD and Relative Strength Index
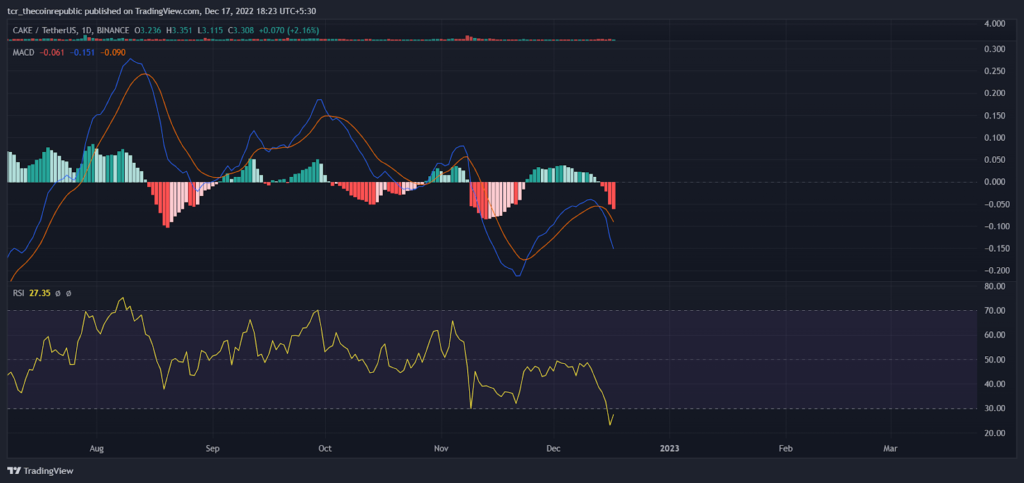
MACD had generated negative crossover and histogram bars getting more deep on downside indicates selling pressure may continue for some more time, whereas RSI at 27 entered oversold zone and price may see some upside reversal in coming days.
Summary
After analyzing the CAKE prices with multiple indicators, prices look little bearish for the short term but it’s risky to create a short position near the support zones. So aggressive traders may look for shorting opportunity on higher levels for the target of $2.978 and below by keeping $4.00 as SL
Technical levels
Resistance levels : $4.141 and $5.096
Support levels : $2.978 and $2.506
Disclaimer
The views and opinions stated by the author, or any people named in this article, are for informational ideas only, and they do not establish financial, investment, or other advice. Investing in or trading crypto assets comes with a risk of financial loss.

Andrew is a blockchain developer who developed his interest in cryptocurrencies while pursuing his post-graduation major in blockchain development. He is a keen observer of details and shares his passion for writing, along with coding. His backend knowledge about blockchain helps him give a unique perspective to his writing skills, and a reliable craft at explaining the concepts such as blockchain programming, languages and token minting. He also frequently shares technical details and performance indicators of ICOs and IDOs.


