
 Home
Home News
News

- ICP prices found stability at $3.420 after the 2 weeks massive fall of almost 25% from higher levels
- ICP rejected 50 day ema and MACD generated fresh negative crossover whereas RSI at 36 may enter oversold zone.
Internet Computer [ICP] had been reversing upwards with mild bullish cues after forming a bullish hammer candle from the support zone of $3.450 As per coinglass, In the last 12 hours ICP derivatives showed 51.99% longs and 48.01% shorts indicating mild bullishness, whereas last 7 days funding rate stood at $0.2100% denotes mild bearishness. As of now, ICP is trading at $3.730 with the intraday gains of 1.39% and 24 hour volume to market cap ratio is stood at 0.0104

What chart is revealing ?
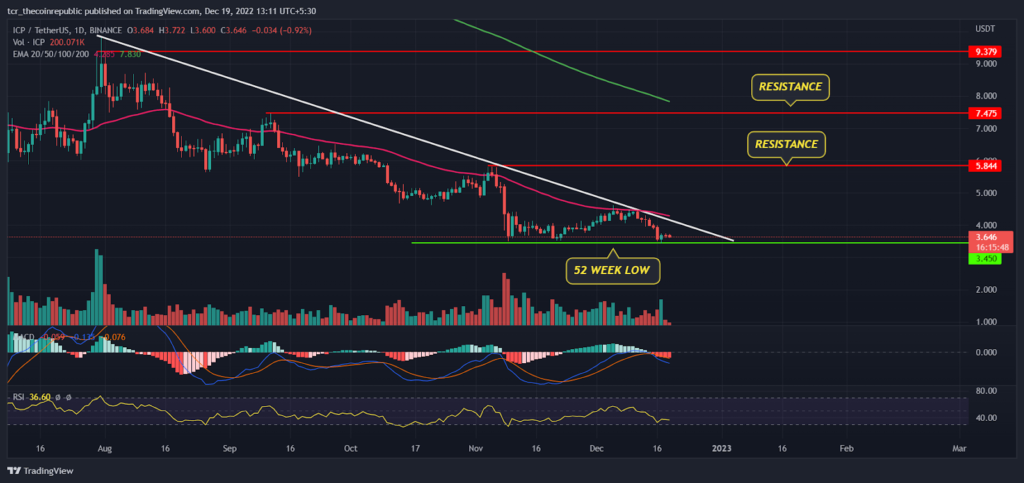
On a higher time frame, ICP prices had been in downtrend and forming lower low swings. In the end of July, prices gained some upside momentum and created a positive hope to investors but unfortunately it resulted as a bull trap and triggered massive selling from the higher levels. Later prices kept on slipping down and bears started dominating on resistance levels.

The 200 day ema (green) sloping down which is far away from the current price indicates a trend to remain weak on a positional basis. The 50 day ema(pink) at $2.485 will act as an immediate hurdle for bulls followed by next barrier will be $5.844 and $7.475. The MACD had been little bullish in the initial phase of December but recently it generated a negative crossover which denotes prices may see further weakness in coming days whereas RSI at 37 sloping sideways may see some reversal from the oversold zones.
Will ICP break Trendline or 52 Week low support ?
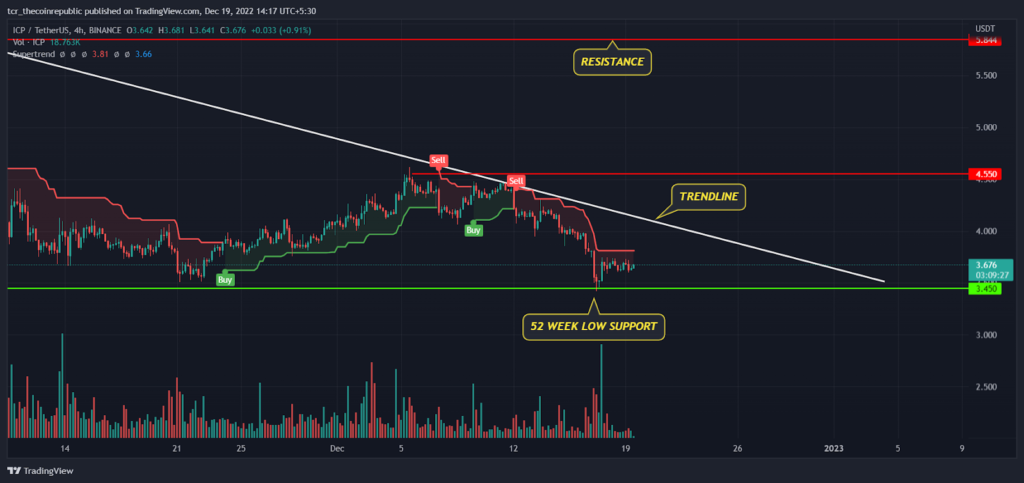
On a lower time frame, ICP had been trading sideways in the range between $3.450 to $4.550 with a mild bearish sentiment. Recently, The ICP bears had attempted to break the lower range but got rejected from the important support zone of $3.500 forming a bullish candle with a higher volume donotes responsive buyers are active on lower levels. The super trend indicator had generated a sell signal from the resistance level indicating a short term trend to remain weak whereas if price succeeded to trade above the falling trend line we may see some short term trend reversal.
Summary
ICP bulls have been struggling a lot to defend the recent lows but technical indicators are still bearish and do not show any signs of trend reversal, but prices are in oversold territory so we may see some relief rally in coming days which will be treated as a shorting opportunity on higher levels. On a lower side if price slipped below $3.450 we may see further downside towards $3.00 levels.
Technical levels
Resistance levels : $4.500 and $5.844
Support levels : $3.450 and $3.000
Disclaimer
The views and opinions stated by the author, or any people named in this article, are for informational ideas only, and they do not establish financial, investment, or other advice. Investing in or trading crypto assets comes with a risk of financial loss.

Nancy J. Allen is a crypto enthusiast, with a major in macroeconomics and minor in business statistics. She believes that cryptocurrencies inspire people to be their own banks, and step aside from traditional monetary exchange systems. She is also intrigued by blockchain technology and its functioning. She frequently researches, and posts content on the top altcoins, their theoretical working principles and technical price predictions.


